So I started building a model using the Layered digraph layout. This is what I have come up with so far
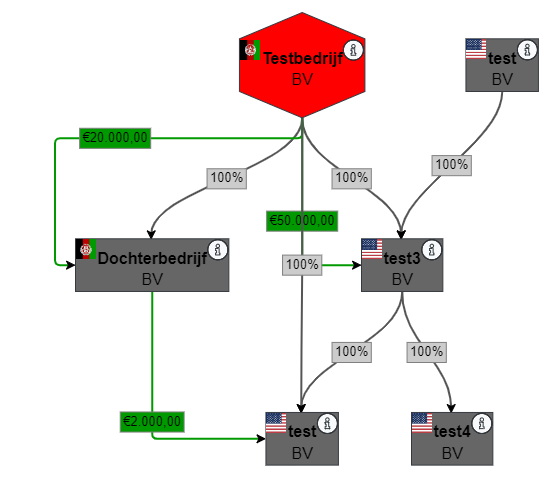
There are a couple of problems that I can’t fix or I want to change
-
I want the link labels to always be in front of the links. In my image you can see a grey line crossing a green box. It would be nice if that line would go behind it, no matter what link label it is.
-
I want the center of the info button to align with the right top corner of the shapes (or at least the rectangles). When I try that now I only see the bottom right corner of the shape or image
-
When I have 2 links between the same nodes they keep following the same path and do not split up as is seen in some of the samples. This seems to be because of the layout type.I kind of fixed this by using a specified port, but I still would like to have that function.
-
With the usage of ports like this. It would be usefull if links going to the right would connect to a port on the left side of the shape and links going to the left would connect on the right side.
My nodes and links are dynamically generated trough a php script fetching data from a database. Underneath is the script that was generated
function init(obj){

  var theme = obj;
  var $ = go.GraphObject.make;
  diagram = $(go.Diagram, "orgChart",
    {
      initialContentAlignment: go.Spot.Center,
    });

  diagram.layout = $(go.LayeredDigraphLayout,
  {
    direction: 90, layerSpacing: 100, columnSpacing: 50
  });

  diagram.nodeTemplate =
      $(go.Node, "Auto",
        {
          margin: 20,
          doubleClick: function(e, node){
            showOrganization(node.data.key)
          }
        },

        $(go.Shape,
          {margin: 0},
          new go.Binding("figure", "fig"),
          {
            fill: "lightgray",  // the initial value, but data binding may provide different value
            stroke: theme.Dark,
          },
          new go.Binding("fill", "color")
        ),
        $(go.Picture, //country flags
            {desiredSize: new go.Size(20,20), alignment: new go.Spot(0,0,1,1), toolTip:
              $("ToolTip",
                $(go.TextBlock, { margin: 4 },
                new go.Binding("text", "country"))
              )
            },
            new go.Binding("source", "flagSource")
          ),

        $(go.Panel, "Vertical", //Block contents
          {margin: new go.Margin(10, 20, 0, 20)},
          $(go.TextBlock,
            {font: "bold 12pt sans-serif", margin: 2},
            new go.Binding("text", "name")),
          $(go.TextBlock,
              {font: "12pt sans-serif", margin: 2},
              new go.Binding("text", "legalForm")),
          ),
          // add info button
          $(go.Shape, { // fill circle
            figure: "Circle",
            desiredSize: new go.Size(20, 20),
            alignment: new go.Spot(1,0,-1,1),
            fill: theme.Light,
            cursor: "pointer",
            click: function(e, obj){showOrganization(obj.part.data.key)}
            },
          ),
          $(go.Shape, { // info sign
            desiredSize: new go.Size(20,20),
            alignment: new go.Spot(1,0,-1,1),
            stroke: theme.Dark,
            cursor: "pointer",
            click: function(e, obj){showOrganization(obj.part.data.key)},
            geometryString: "M256 8C119.043 8 8 119.083 8 256c0 136.997 111.043 248 248 248s248-111.003 248-248C504 119.083 392.957 8 256 8zm0 110c23.196 0 42 18.804 42 42s-18.804 42-42 42-42-18.804-42-42 18.804-42 42-42zm56 254c0 6.627-5.373 12-12 12h-88c-6.627 0-12-5.373-12-12v-24c0-6.627 5.373-12 12-12h12v-64h-12c-6.627 0-12-5.373-12-12v-24c0-6.627 5.373-12 12-12h64c6.627 0 12 5.373 12 12v100h12c6.627 0 12 5.373 12 12v24z"
            },
          ),
          $(go.Shape, { //primary port
            desiredSize: new go.Size(1,1),
            alignment: new go.Spot(0.5,0,-1,1),
            portId: "A",
            toSpot: go.Spot.Left,
            fill: "transparent",
            stroke: null
          }),
          $(go.Shape, { //secondary port
            desiredSize: new go.Size(1,1),
            alignment: new go.Spot(0,0.5,0,0),
            portId: "B",
            toSpot: go.Spot.Left,
            fill: "transparent",
            angle: 270,
            stroke: null
          }),
          $(go.Shape, { //Out port
            desiredSize: new go.Size(1,1),
            alignment: new go.Spot(1,0.5,-1,1),
            portId: "Out",
            toSpot: go.Spot.Left,
            fill: "transparent",
            stroke: null
          })
        )


  diagram.linkTemplate =
    $(go.Link, {
      corner: 5,
      curviness: 10,
      toEndSegmentLength: 50,
      fromEndSegmentLength: 50,
      toShortLength: 5,
      layerName: "Background",
      toSpot: go.Spot.Left,
      doubleClick: function(e, link){
          showRelation(link.data.linkId);
        }
      },
      new go.Binding("routing", "routing"),
      new go.Binding("curve", "curve"),
      new go.Binding("curviness", "curviness"),
      new go.Binding("fromEndSegmentLength", "fromEndSegmentLength"),
      new go.Binding("toEndSegmentLength", "toEndSegmentLength"),
      $(go.Shape, {stroke: "#555", strokeWidth: 2},//line
      new go.Binding("stroke", "linkColor")),
      $(go.Shape, { toArrow: "Standard"}), //arrowhead
      $(go.Panel, "Auto",// link label
        $(go.Shape, "Rectangle", { fill: "#999", stroke: "gray"}, // default color
        new go.Binding("fill", "labelColor")),
        $(go.TextBlock, { margin: 3 },
          new go.Binding("text", "text"))
        )
    );

  //retreive nodes from controller
  var nodeDataArray = [
{key: 1,
                          "name": "Testbedrijf",
                          "legalForm": "BV",
                          "fig" : "Hexagon",
                          "color": "#FF0000",
                          "flagSource": "/images/flags_square/af.svg",
                          "country": "Afghanistan"
                        },
{key: 2,
                          "name": "Dochterbedrijf",
                          "legalForm": "BV",
                          "fig" : "Rectangle",
                          "color": "#666666",
                          "flagSource": "/images/flags_square/af.svg",
                          "country": "Afghanistan"
                        },
{key: 4,
                          "name": "test",
                          "legalForm": "BV",
                          "fig" : "Rectangle",
                          "color": "#666666",
                          "flagSource": "/images/flags_square/us.svg",
                          "country": "United States"
                        },
{key: 5,
                          "name": "test3",
                          "legalForm": "BV",
                          "fig" : "Rectangle",
                          "color": "#666666",
                          "flagSource": "/images/flags_square/us.svg",
                          "country": "United States"
                        },
{key: 6,
                          "name": "test4",
                          "legalForm": "BV",
                          "fig" : "Rectangle",
                          "color": "#666666",
                          "flagSource": "/images/flags_square/us.svg",
                          "country": "United States"
                        },
{key: 7,
                          "name": "test",
                          "legalForm": "BV",
                          "fig" : "Rectangle",
                          "color": "#666666",
                          "flagSource": "/images/flags_square/us.svg",
                          "country": "United States"
                        },
];
  //retreive links from controller
  var linkDataArray = [
{"linkId": 1,
          from: 1,
          to: 2,
          routing: go.Link.Normal,
          curviness: 0,
          "text": "100%",
          "curve": go.Link.Bezier,
          "linkColor" : "#555555",
          "labelColor": "#CCCCCC",
          "toEndSegmentLength" : 50,
          "fromEndSegmentLength" : 50,
          fromPort : "out",
          toPort: "A",
          },
{"linkId": 2,
          from: 1,
          to: 5,
          routing: go.Link.Normal,
          curviness: 0,
          "text": "100%",
          "curve": go.Link.Bezier,
          "linkColor" : "#555555",
          "labelColor": "#CCCCCC",
          "toEndSegmentLength" : 50,
          "fromEndSegmentLength" : 50,
          fromPort : "out",
          toPort: "A",
          },
{"linkId": 3,
          from: 1,
          to: 5,
          routing: go.Link.AvoidsNodes,
          curviness: 100,
          "text": "€50.000,00",
          "curve": go.Link.None,
          "linkColor" : "#009900",
          "labelColor": "#009900",
          "toEndSegmentLength" : 20,
          "fromEndSegmentLength" : 20,
          fromPort : "out",
          toPort: "B",
          },
{"linkId": 4,
          from: 4,
          to: 5,
          routing: go.Link.Normal,
          curviness: 0,
          "text": "100%",
          "curve": go.Link.Bezier,
          "linkColor" : "#555555",
          "labelColor": "#CCCCCC",
          "toEndSegmentLength" : 50,
          "fromEndSegmentLength" : 50,
          fromPort : "out",
          toPort: "A",
          },
{"linkId": 5,
          from: 1,
          to: 2,
          routing: go.Link.AvoidsNodes,
          curviness: 100,
          "text": "€20.000,00",
          "curve": go.Link.None,
          "linkColor" : "#009900",
          "labelColor": "#009900",
          "toEndSegmentLength" : 20,
          "fromEndSegmentLength" : 20,
          fromPort : "out",
          toPort: "B",
          },
{"linkId": 6,
          from: 5,
          to: 6,
          routing: go.Link.Normal,
          curviness: 0,
          "text": "100%",
          "curve": go.Link.Bezier,
          "linkColor" : "#555555",
          "labelColor": "#CCCCCC",
          "toEndSegmentLength" : 50,
          "fromEndSegmentLength" : 50,
          fromPort : "out",
          toPort: "A",
          },
{"linkId": 7,
          from: 5,
          to: 7,
          routing: go.Link.Normal,
          curviness: 0,
          "text": "100%",
          "curve": go.Link.Bezier,
          "linkColor" : "#555555",
          "labelColor": "#CCCCCC",
          "toEndSegmentLength" : 50,
          "fromEndSegmentLength" : 50,
          fromPort : "out",
          toPort: "A",
          },
{"linkId": 8,
          from: 1,
          to: 7,
          routing: go.Link.Normal,
          curviness: 0,
          "text": "100%",
          "curve": go.Link.Bezier,
          "linkColor" : "#555555",
          "labelColor": "#CCCCCC",
          "toEndSegmentLength" : 50,
          "fromEndSegmentLength" : 50,
          fromPort : "out",
          toPort: "A",
          },
{"linkId": 9,
          from: 2,
          to: 7,
          routing: go.Link.AvoidsNodes,
          curviness: 100,
          "text": "€2.000,00",
          "curve": go.Link.None,
          "linkColor" : "#009900",
          "labelColor": "#009900",
          "toEndSegmentLength" : 20,
          "fromEndSegmentLength" : 20,
          fromPort : "out",
          toPort: "B",
          },
];

  diagram.model = $(go.GraphLinksModel, {
    linkFromPortIdProperty: "fromPort",
    linkToPortIdProperty: "toPort",
    nodeDataArray: nodeDataArray,
    linkDataArray: linkDataArray
  });
}