Hi
I am creating organization chart
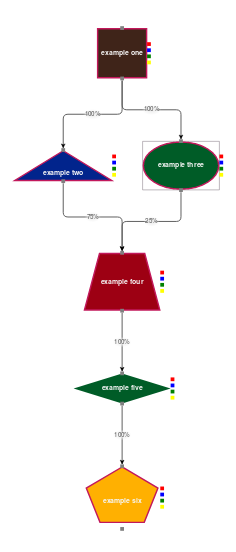
i have multi type of nodes like
reactangle,
reactangle with triangle inside,
oval within reactangle,
circle,
diamond,
triangle,
reactangle with triangleDown inside,
rectangle with circle inside,
trapezoid,
oval_within_reactangle,
pentagon
Every type showing his company type with his shape and color
Every node template has six ports up, down, and ports on right,
top and bottom ports are in used to show parent and child structure and other three ports are in used to show three different types of transactions between nodes/companies
example:
i am using go.LayeredDigraphLayout, with direction:90
Every thing is working fine,
but now i have receive the data from client its about 1400 node and links between.
now i am face slow loading or slow layout problem getting page unresponsive alert from browser. chart finally generated but getting to much time causing page unresponsive alert from browser.
i am searching from last two weeks and try many thing also read GoJS Performance Considerations -- Northwoods Software and have also try Virtualized Tree with custom layout in this case you have already know about node’s bounds and you collect node by visible area and show in main view able area.
why i am not using tree layout?
because i have multiple links between nodes like at the bottom node has two or three parents once from top level and once from low level that’s why tree layout not meeting my needs.
is there a way to speed up
myDiagram.layoutDiagram(true);
Thanks