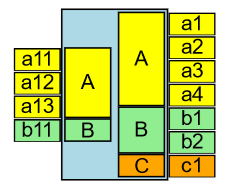
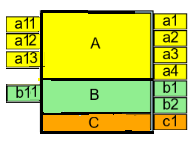
Well, it’s easy to filter the ports for each side:

<!DOCTYPE html>
<html>

<head>
  <title>Grouped Ports</title>
  <!-- Copyright 1998-2024 by Northwoods Software Corporation. -->
  <meta name="description" content="A Node whose lists of ports are grouped together.">
  <meta name="viewport" content="width=device-width, initial-scale=1">
</head>

<body>
  <div id="myDiagramDiv" style="border: solid 1px black; width:100%; height:600px"></div>

  <script src="../latest/release/go.js"></script>
  <script id="code">
    const $ = go.GraphObject.make;

    const myDiagram =
      new go.Diagram("myDiagramDiv");

    myDiagram.nodeTemplate =
      $(go.Node,
        $(go.Panel, "Table",
          $(go.Shape,
            { column: 1, columnSpan: 2, fill: "white", stretch: go.Stretch.Fill },
            new go.Binding("fill", "color")),
          $(go.Panel, "Table",
            { column: 0 },
            new go.Binding("itemArray", "ports", a => getPorts(a, true)),
            {
              itemTemplate:
                $(go.Panel, "Spot",
                  new go.Binding("portId", "id"),
                  new go.Binding("row", "index"),
                  { width: 30, height: 15 },
                  $(go.Shape,
                    { fill: "white" },
                    new go.Binding("fill", "color")),
                  $(go.TextBlock,
                    { margin: new go.Margin(1, 0, 0, 0) },
                    new go.Binding("text", "id"))
                )
            }
          ),
          $(go.Panel, "Table",
            { column: 1, alignment: go.Spot.Right, margin: 2 },
            new go.Binding("itemArray", "ports", a => convertPortsToAttributes(a, true)),
            {
              itemTemplate:
                $(go.Panel, "Auto",
                  new go.Binding("row", "index"),
                  { width: 30, height: 15 },
                  new go.Binding("height", "rows", r => r * 15),
                  $(go.Shape,
                    { fill: "white", stretch: go.Stretch.Fill },
                    new go.Binding("fill", "color")),
                  $(go.TextBlock,
                    { margin: new go.Margin(1, 0, 0, 0) },
                    new go.Binding("text"))
                )
            }
          ),
          $(go.Panel, "Table",
            { column: 2, alignment: go.Spot.Right, margin: 2 },
            new go.Binding("itemArray", "ports", a => convertPortsToAttributes(a, false)),
            {
              itemTemplate:
                $(go.Panel, "Auto",
                  new go.Binding("row", "index"),
                  { width: 30, height: 15 },
                  new go.Binding("height", "rows", r => r * 15),
                  $(go.Shape,
                    { fill: "white", stretch: go.Stretch.Fill },
                    new go.Binding("fill", "color")),
                  $(go.TextBlock,
                    { margin: new go.Margin(1, 0, 0, 0) },
                    new go.Binding("text"))
                )
            }
          ),
          $(go.Panel, "Table",
            { column: 3 },
            new go.Binding("itemArray", "ports", a => getPorts(a, false)),
            {
              itemTemplate:
                $(go.Panel, "Spot",
                  new go.Binding("portId", "id"),
                  new go.Binding("row", "index"),
                  { width: 30, height: 15 },
                  $(go.Shape,
                    { fill: "white" },
                    new go.Binding("fill", "color")),
                  $(go.TextBlock,
                    { margin: new go.Margin(1, 0, 0, 0) },
                    new go.Binding("text", "id"))
                )
            }
          ),
        )
      );

    function getPorts(arr, left) {
      const a2 = [];
      arr.forEach(port => {
        if (left && port.side !== "left") return;
        if (!left && port.side === "left") return;
        a2.push(port);
      });
      return a2;
    }

    function convertPortsToAttributes(arr, left) {
      const a2 = [];
      let prevText = "";
      arr.forEach(port => {
        if (left && port.side !== "left") return;
        if (!left && port.side === "left") return;
        if (port.text !== prevText) {
          a2.push({ index: port.index, rows: 1, text: port.text, color: port.color });
          prevText = port.text;
        } else {
          a2[a2.length - 1].rows++;
        }
      });
      return a2;
    }

    myDiagram.model = new go.GraphLinksModel({
      linkFromPortIdProperty: "fpid",
      linkToPortIdProperty: "tpid",
      nodeDataArray: [
        {
          key: 1, text: "Alpha", color: "lightblue",
          ports: [
            { id: "a1", index: 0, text: "A", color: "yellow", side: "right" },
            { id: "a2", index: 1, text: "A", color: "yellow", side: "right" },
            { id: "a3", index: 2, text: "A", color: "yellow", side: "right" },
            { id: "a4", index: 3, text: "A", color: "yellow", side: "right" },
            { id: "b1", index: 4, text: "B", color: "lightgreen", side: "right" },
            { id: "b2", index: 5, text: "B", color: "lightgreen", side: "right" },
            { id: "c1", index: 6, text: "C", color: "orange", side: "right" },
            { id: "a11", index: 0, text: "A", color: "yellow", side: "left" },
            { id: "a12", index: 1, text: "A", color: "yellow", side: "left" },
            { id: "a13", index: 2, text: "A", color: "yellow", side: "left" },
            { id: "b11", index: 3, text: "B", color: "lightgreen", side: "left" },
          ]
        }
      ]
    }
    );
  </script>
</body>

</html>

