Not able to resize panel containing ports properly

I am trying out your example dataflow.html (Data Flow Diagram) and made the node resizable to be able to resize the nodes. But when I resize, the panel inside the node doesn’t resize. How do I make the panels inside the node resize as I resize the node?

Thanks,

The easiest solution is to set the Part.resizeObjectName to refer to the Panel whose width and height are set to 100 and 120.

That solved part of the problem. The panel with the width and height of 100 and 120 is resizing properly but the Text Panels within that panel is not resizing. The port panels are not resizing as well.

Well, you have a lot of choices, depending on the behavior that you want. Initially you said you wanted some panel to be resized, so I thought giving that “Auto” Panel a name and referring to it as the Node.resizeObjectName would be sufficient.

But apparently not. Could you be more specific about the behavior that you want? Showing sketches or screenshots of the possibilities, dependent on the size and numbers of the objects within the node, would be helpful.

I am showing the original node and a node that has been resized down. When I resize down the Node, I want the Text size and Ports size to resize down as well. Right now, I am only able to shrink the panel but the Text and the Ports remain at the original size.

image

image

Make the Node a “Viewbox” Panel, wrapping the old definition of the node. Remove the rotateObjectName and remember to move Part property settings and bindings back up to the Node level from what had been the Node but now is a Panel.

I tried that but getting an error that “Viewbox Panel cannot contain more than one GraphObject.” If I use the standard function makeTemplate in the dataFlow.html example. If I wrap the inports and outports panel inside the viewbox panel, then I lose the ability to draw links from the ports to another node.

function makeTemplate(typename, icon, background, inports, outports) {
var node = $(go.Part, “Spot”,
{resizable: true, resizeObjectName: “PANEL”},
$(go.Panel, “Viewbox”, {name: “PANEL”},
$(go.Panel, “Auto”,
{ width: 100, height: 120},
//{stretch: go.GraphObject.Fill, minSize: new go.Size(50, 50)},
$(go.Shape, “Rectangle”,
{
fill: background, stroke: null, strokeWidth: 0,
//spot1: go.Spot.TopLeft, spot2: go.Spot.BottomRight
}),
$(go.Panel, “Table”,
$(go.TextBlock, typename,
{
row: 0,
margin: 3,
//stretch: go.GraphObject.Fill,
maxSize: new go.Size(80, NaN),
stroke: “white”,
font: “bold 11pt sans-serif”
}),
/$(go.Picture, icon,
{ row: 1, width: 55, height: 55 }),
/
$(go.TextBlock,
{
row: 2,
margin: 3,
editable: true,
//stretch: go.GraphObject.Fill,
maxSize: new go.Size(8, 4),
stroke: “white”,
font: “bold 9pt sans-serif”
},
new go.Binding(“text”, “name”).makeTwoWay())
),
/$(go.Panel, “Vertical”,
{
alignment: go.Spot.Left,
alignmentFocus: new go.Spot(0, 0.5, -8, 0)
},
inports),
$(go.Panel, “Vertical”,
{
alignment: go.Spot.Right,
alignmentFocus: new go.Spot(1, 0.5, 8, 0)
},
outports)
/
),
$(go.Panel, “Vertical”,
{
alignment: go.Spot.Left,
alignmentFocus: new go.Spot(0, 0.5, -8, 0)
},
inports),
$(go.Panel, “Vertical”,
{
alignment: go.Spot.Right,
alignmentFocus: new go.Spot(1, 0.5, 8, 0)
},
outports)
));
myDiagram.nodeTemplateMap.add(typename, node);
}

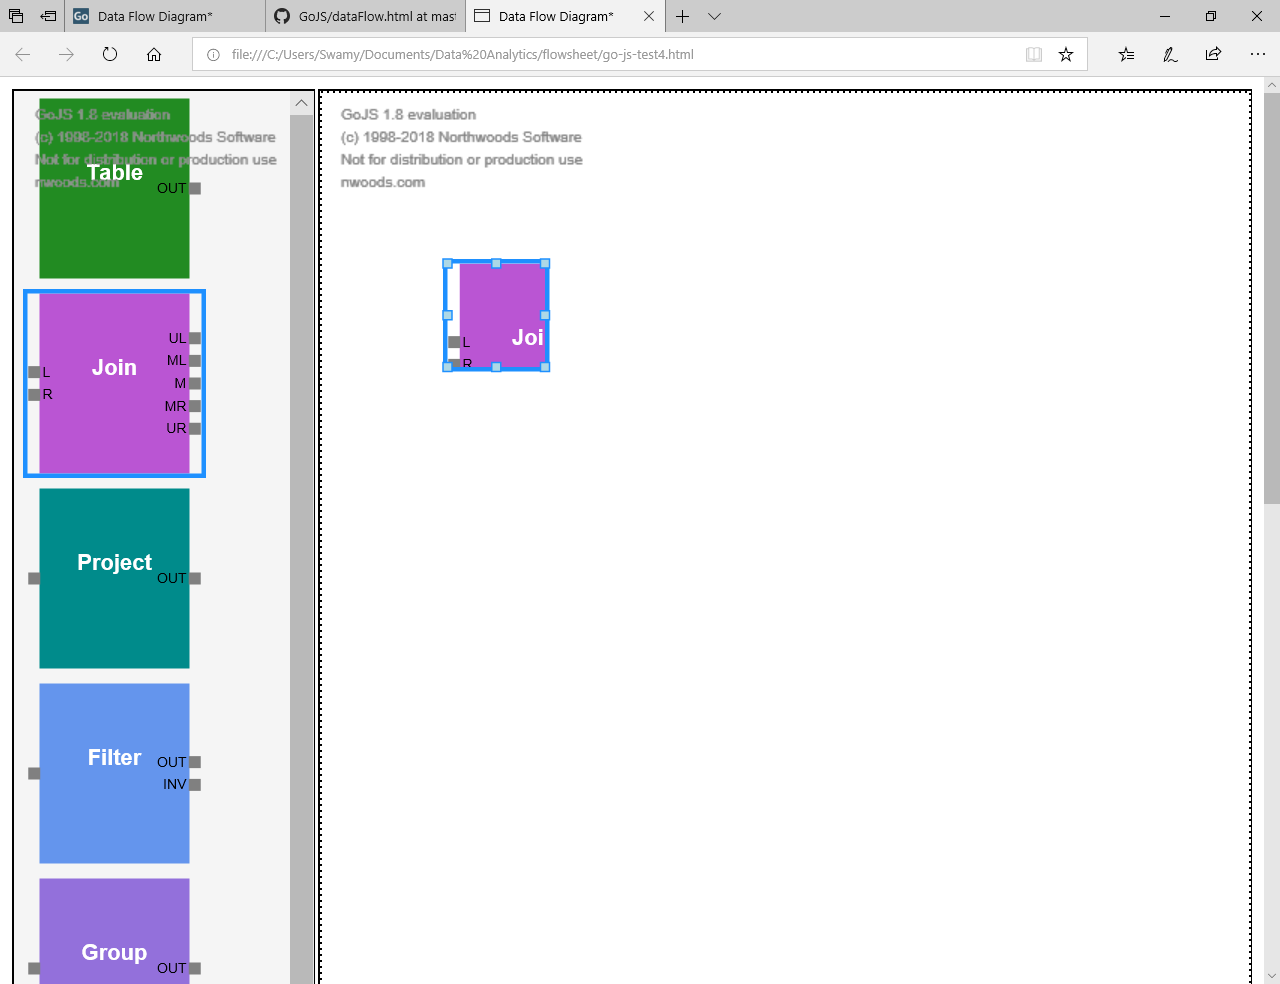
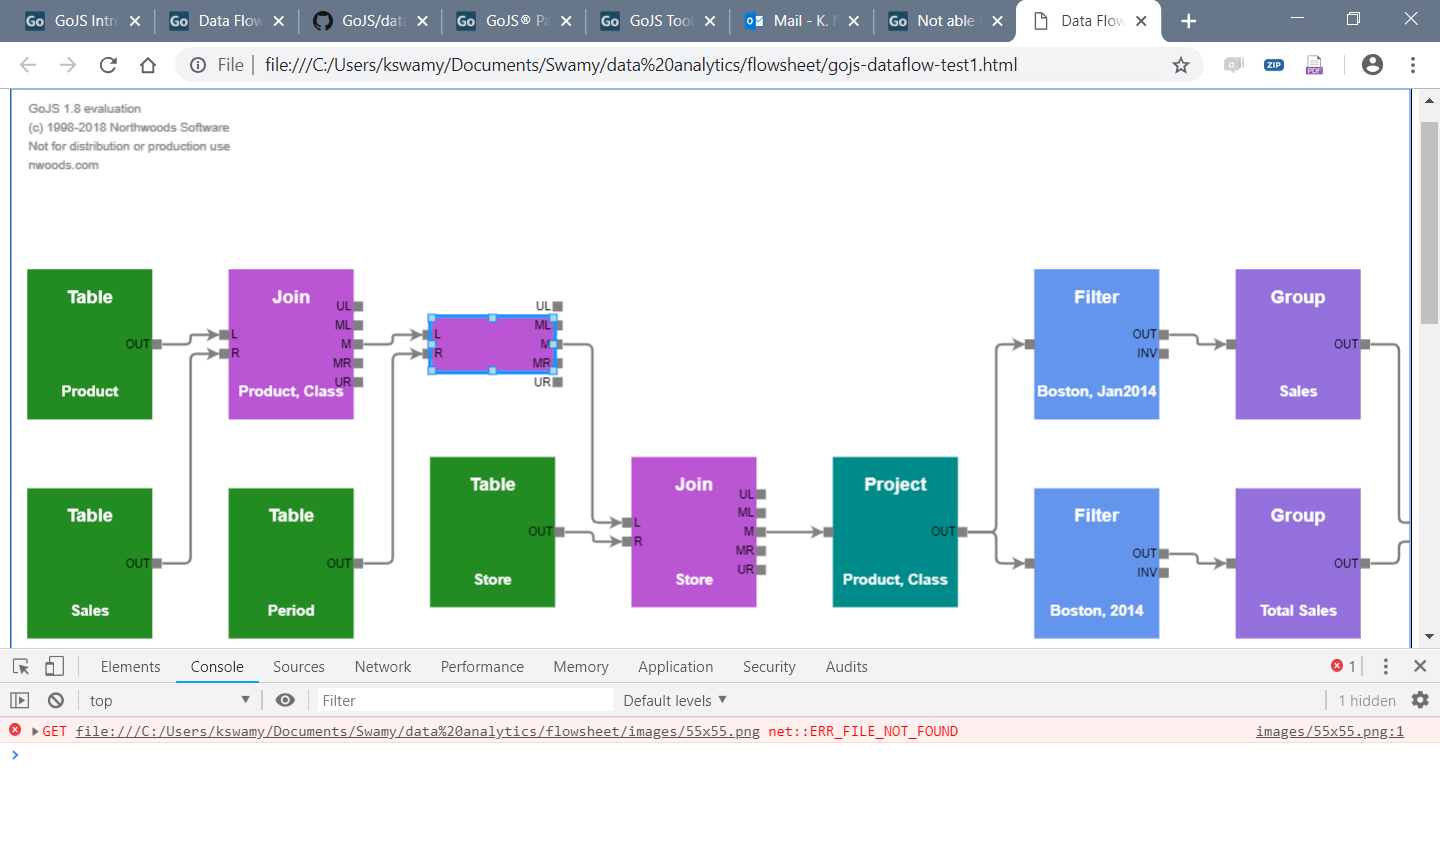
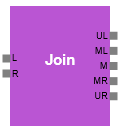
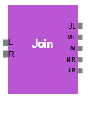
I sort of got it working. I made the Node a Viewbox and then made the Panel underneath it a “spot” panel. I put the inports and outports panel underneath this “spot” panel. Only thing is that the outports weren’t showing up with original go.Spot(1,0.5,8,0) and had to change it to go.Spot(1,0.5,-8,0) and the outports are now showing inside the panel. It works though now. It would be better to have the outports showing out rather than be inside the rectangle but I am happy with it for now that I am going to move on.

function makeTemplate(typename, icon, background, inports, outports) {
var node = /(go.Part, "Spot", {resizable: true, resizeObjectName: "PANEL"},*/ (go.Node, “Viewbox”, {resizable: true},
(go.Panel, "Spot", { width: 100, height: 120}, //{stretch: go.GraphObject.Fill, minSize: new go.Size(50, 50)}, (go.Shape, “Rectangle”,
{
fill: background, stroke: null, strokeWidth: 0,
//spot1: go.Spot.TopLeft, spot2: go.Spot.BottomRight
}),
(go.Panel, "Table", (go.TextBlock, typename,
{
row: 0,
margin: 3,
//stretch: go.GraphObject.Fill,
maxSize: new go.Size(80, NaN),
stroke: “white”,
font: “bold 11pt sans-serif”
}),
/
(go.Picture, icon, { row: 1, width: 55, height: 55 }),*/ (go.TextBlock,
{
row: 2,
margin: 3,
editable: true,
//stretch: go.GraphObject.Fill,
maxSize: new go.Size(8, 4),
stroke: “white”,
font: “bold 9pt sans-serif”
},
new go.Binding(“text”, “name”).makeTwoWay())
),
(go.Panel, "Vertical", { alignment: go.Spot.Left, alignmentFocus: new go.Spot(0, 0.5, -8, 0) }, inports), (go.Panel, “Vertical”,
{
alignment: go.Spot.Right,
alignmentFocus: new go.Spot(1, 0.5, -8, 0)
},
outports)
),
/(go.Panel, "Vertical", { alignment: go.Spot.Left, alignmentFocus: new go.Spot(0, 0.5, -8, 0) }, inports), (go.Panel, “Vertical”,
{
alignment: go.Spot.Right,
alignmentFocus: new go.Spot(1, 0.5, 8, 0)
},
outports)
/
);
myDiagram.nodeTemplateMap.add(typename, node);
}

Thanks very much for your help with this problem.