Orthogonal Multi Node Path Link

Hi all.

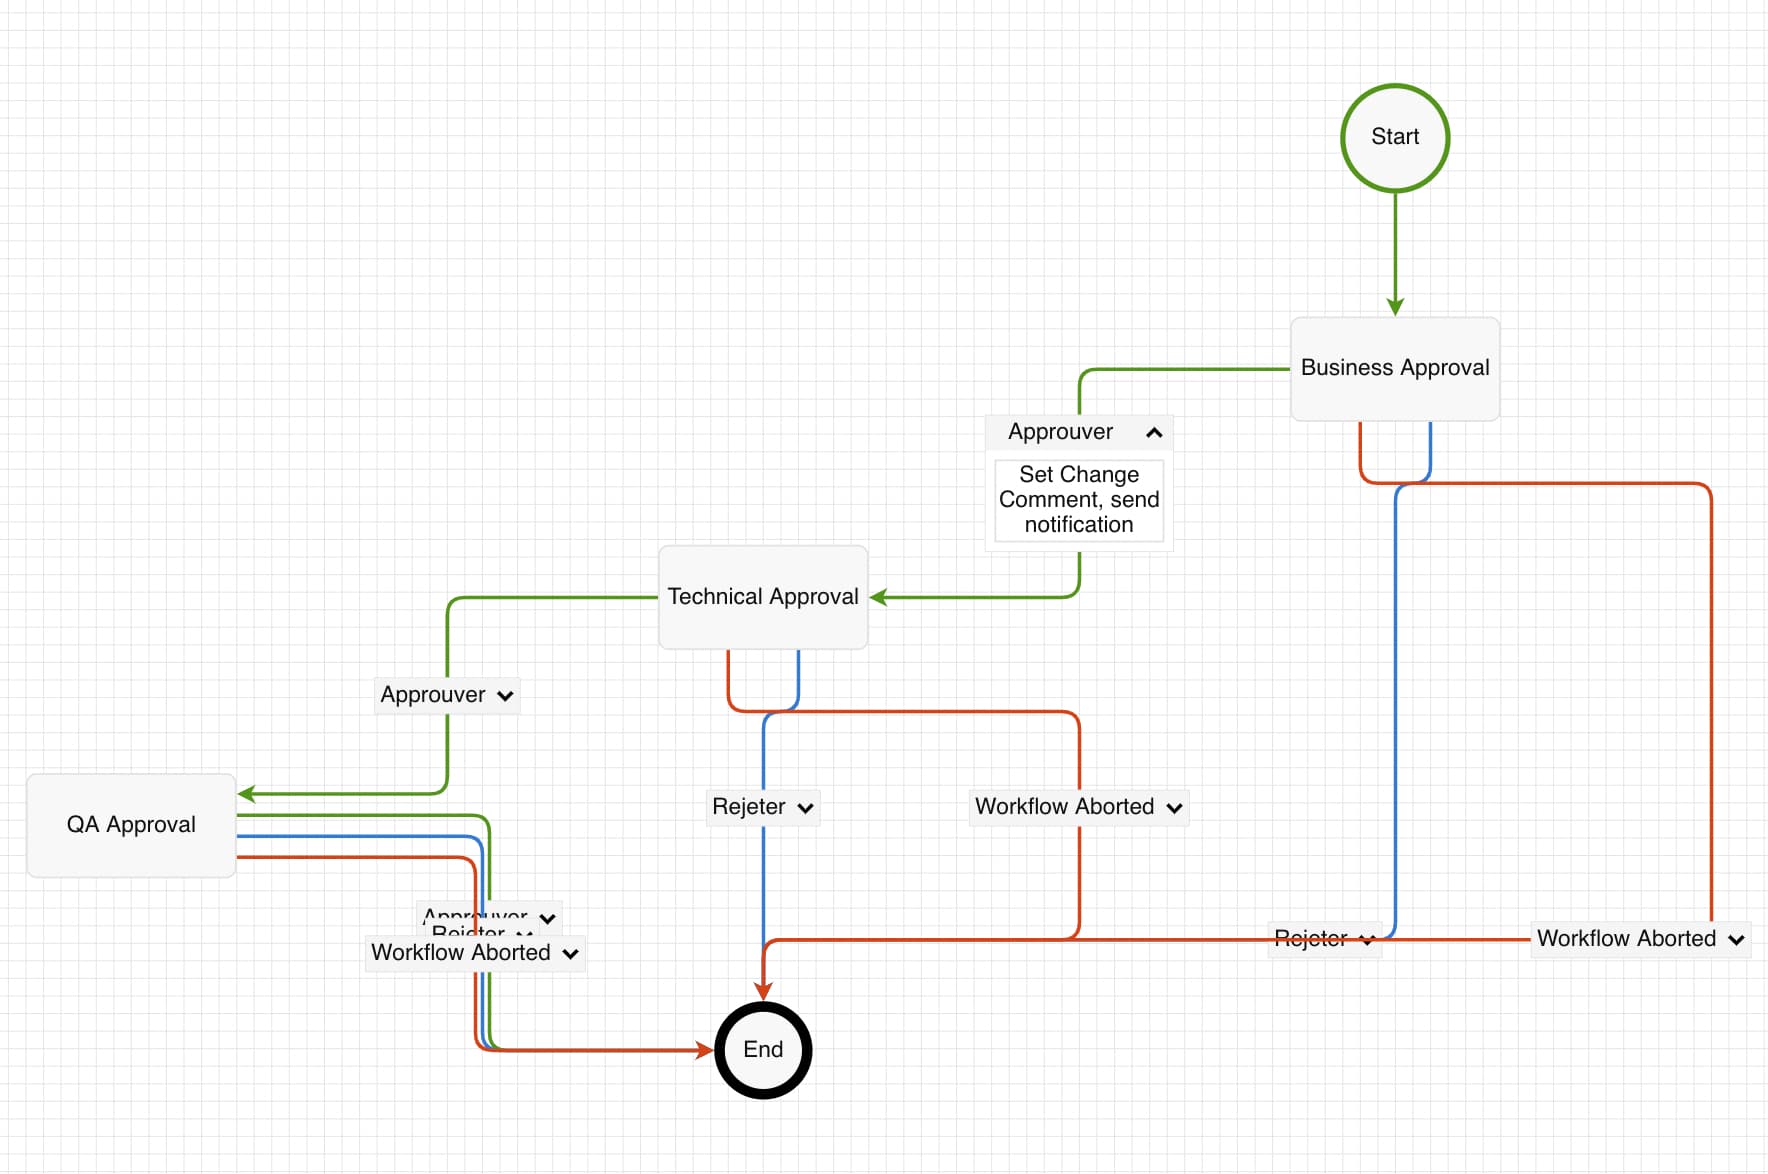
So I have a diagram like in screenshot, which is visually what I need.

My problem is now in code complexity. I need to treat some Links like 1 Link. For example the Link from Business Approval (BA) to Technical Approval (TA) basically in our Model it is just 1 link called Transition, which is composed of 2 child links: one from BA to the Group and another from Group to TA node. So whenever I add or delete a transition basically I need to delete 2 links and the intermediate group between them.

I’m thinking how to do this better and easier considering undo/redo operations as well and other complexities related to our data/payload. I have a few solutions in mind:

  1. Continue with current example (as in screenshot). But override CommandHandler and for example when one sub-link is selected and about to be delete, find all parts to this overall transitions: 2 child links, and the group node between them and remove them all in 1 transaction which basically will be called “delete transition”

  2. Adjust the diagram somehow like in Multi-Node Path Links. So the transition BA → Group → TA link is treated as a 1 link. The problem I’m facing is that the MultiNodePath Link works well for Bezier only but not Orthogonal. I replaced Bezier with Orthogonal in that example and the routing is very poor and I can’t reshape the links - basically if there could be a combination of first solution and this one, probably would work.

  3. Transform in solution 1. the group panel (which can have a few Rectangles inside not just one ) to behave like the Link’s label. Seems to be easy in theory and is next I’m going to try.

Any ideas/thoughts are much appreciated.

The advantage of #3 is that it is closer in structure to your model. You must already have code to turn a transition in your model into two links and a group in the GoJS model. Adding code to handle copying (if supported) and deletion should not be difficult, so I believe #1 would be easiest for you to implement now.

The advantage of #1 over #3 is that the layout will automatically handle the different (and varying?) sizes of those Groups. If you changed those Groups to be label Nodes of (single) Links, the layout would normally ignore the size of any labels. But it should be possible to enhance the layout to compute the layer space needed based on the heights of the label Groups of the Links between layers. So #3 is quite feasible but requires more work.

#2 is also quite possible but would require more work. The reason that sample doesn’t handle orthogonal routing is because its custom Link class was designed to be curved. And I don’t know if there might be problems with layouts.

So I’ve just done #3 and now Link labels basically are like groups. Yeah layout can’t arrange well as you said, but if there’s way to tweak it (please give me some ideas) so it takes in account labels size too, would be great. Otherwise as an initial generated diagram it is acceptable and further the user will reorganise a little some links here and there, so all labels become visible and coordinates will be saved so on next views everything will be visible.

Thanks for feedback Walter. Great library btw.

Here’s some old code I found that might do what you want. I don’t know if it will work for you. You might need to fiddle with the implementation of findMaxLabelWidth.

<!DOCTYPE html>
<html>
<head>
  <title>LayeredDigraphLayout with Link Labels</title>
  <!-- Copyright 1998-2022 by Northwoods Software Corporation. -->
  <meta name="description" content="">
  <meta name="viewport" content="width=device-width, initial-scale=1">

  <script src="https://unpkg.com/gojs"></script>
  <script id="code">
  function findMaxLabelWidth(edges, angle) {
    var w = 0;
    edges.each(function(e) {
      var link = e.link;
      if (!link) return;
      var lab = link.findMidLabel();
      if (lab) {
        if (angle === 90 || angle === 270) {
          w = Math.max(w, lab.actualBounds.height);
        } else {
          w = Math.max(w, lab.actualBounds.width);
        }
      }
    });
    return w;
  }

  function init() {
    var $ = go.GraphObject.make;

    myDiagram =
      $(go.Diagram, "myDiagramDiv",
          {
            "animationManager.isEnabled": false,
            "undoManager.isEnabled": true,
            layout:
              $(go.LayeredDigraphLayout,
                {
                  direction: 0,
                  nodeMinLayerSpace: function(v, topleft) {
                    if (v.node === null) return 0;
                    var needed = findMaxLabelWidth(topleft ? v.sourceEdges : v.destinationEdges, this.direction)/2;
                    if (this.direction === 90 || this.direction === 270) {
                      if (topleft) {
                        return v.focus.y + 10 + needed;
                      } else {
                        return v.bounds.height - v.focus.y + 10 + needed;
                      }
                    } else {
                      if (topleft) {
                        return v.focus.x + 10 + needed;
                      } else {
                        return v.bounds.width - v.focus.x + 10 + needed;
                      }
                    }
                  }
                })
          });

    myDiagram.nodeTemplate =
      $(go.Node, "Auto",
        { width: 100, height: 50 },
        $(go.Shape,
          { fill: "white", portId: "", fromLinkable: true, toLinkable: true, cursor: "pointer" },
          new go.Binding("fill", "color")),
        $(go.TextBlock,
          { margin: 8, editable: true },
          new go.Binding("text").makeTwoWay())
      );

    myDiagram.linkTemplate =
      $(go.Link,
        { routing: go.Link.Orthogonal },
        $(go.Shape),
        $(go.Shape, { toArrow: "OpenTriangle" }),
        $(go.TextBlock, new go.Binding("text"))
      );

    myDiagram.model = new go.GraphLinksModel(
    [
      { key: 1, text: "Alpha", color: "lightblue" },
      { key: 2, text: "Beta", color: "orange" },
      { key: 3, text: "Gamma", color: "lightgreen" },
      { key: 5, text: "Epsilon", color: "yellow" }
    ],
    [
      { from: 1, to: 2, text: "short" },
      { from: 1, to: 3, text: "a very long label" },
      { from: 1, to: 5, text: "a terribly verbose and wordy label" },
      { from: 2, to: 5 },
    ]);
  }
  </script>
</head>
<body onload="init()">
  <div id="myDiagramDiv" style="border: solid 1px black; width:100%; height:600px"></div>
</body>
</html>

Also, in a different but related issue, you might be interested in repositioning the labels along the link paths. The following sample assumes that the links are straight, not orthogonal, but hopefully it will give you an idea of how to implement such a customization: LayeredDigraphLayout spreading link labels