Performance issue when zooming/panning using LayeredDigraphLayout in GoJS 3.0.8

Hi Walter,

I created a separate topic for the issue I am facing when zooming/panning in my diagram, as you suggested in Performance issue when adding nodes using a LayeredDigraphLayout in GoJS 3.0.8 - #4 by walter

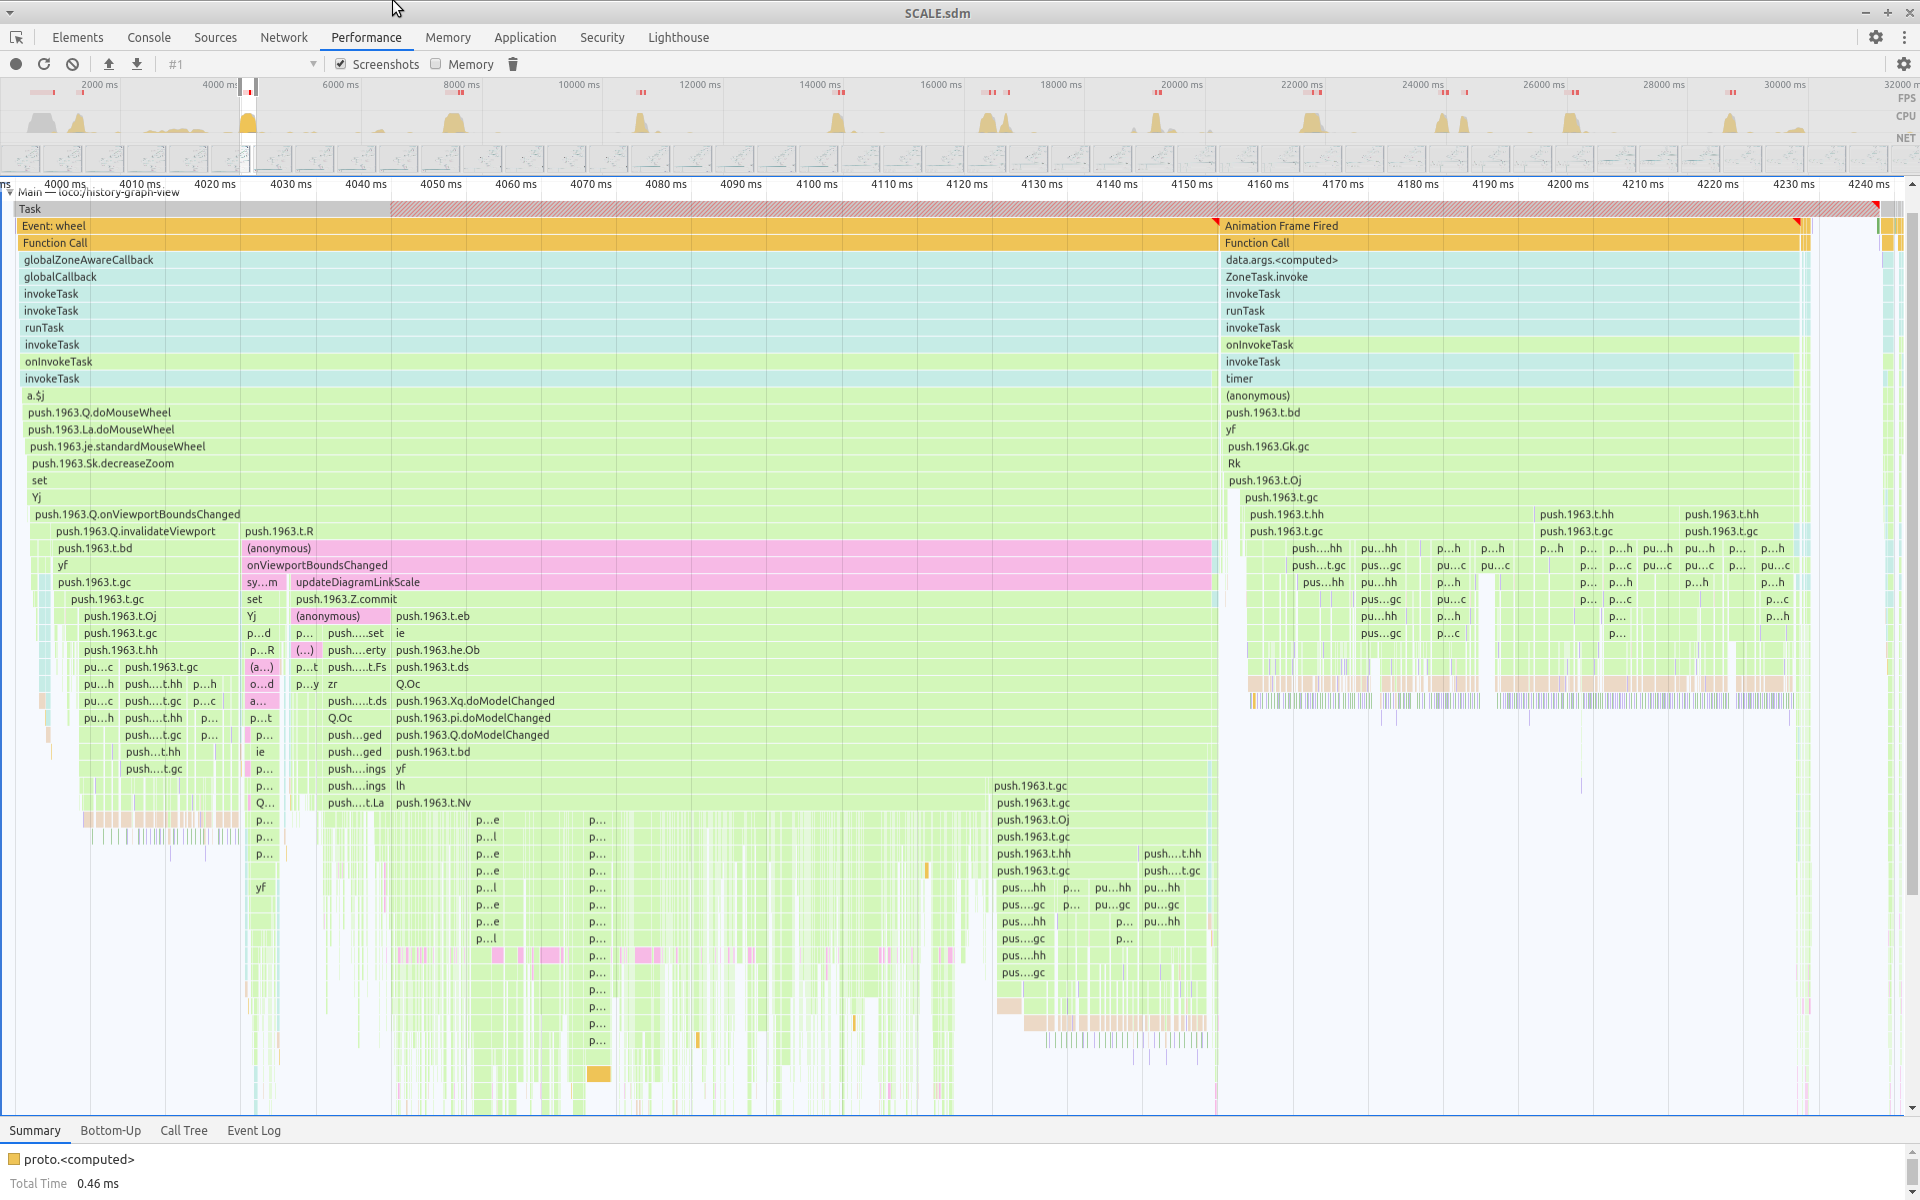
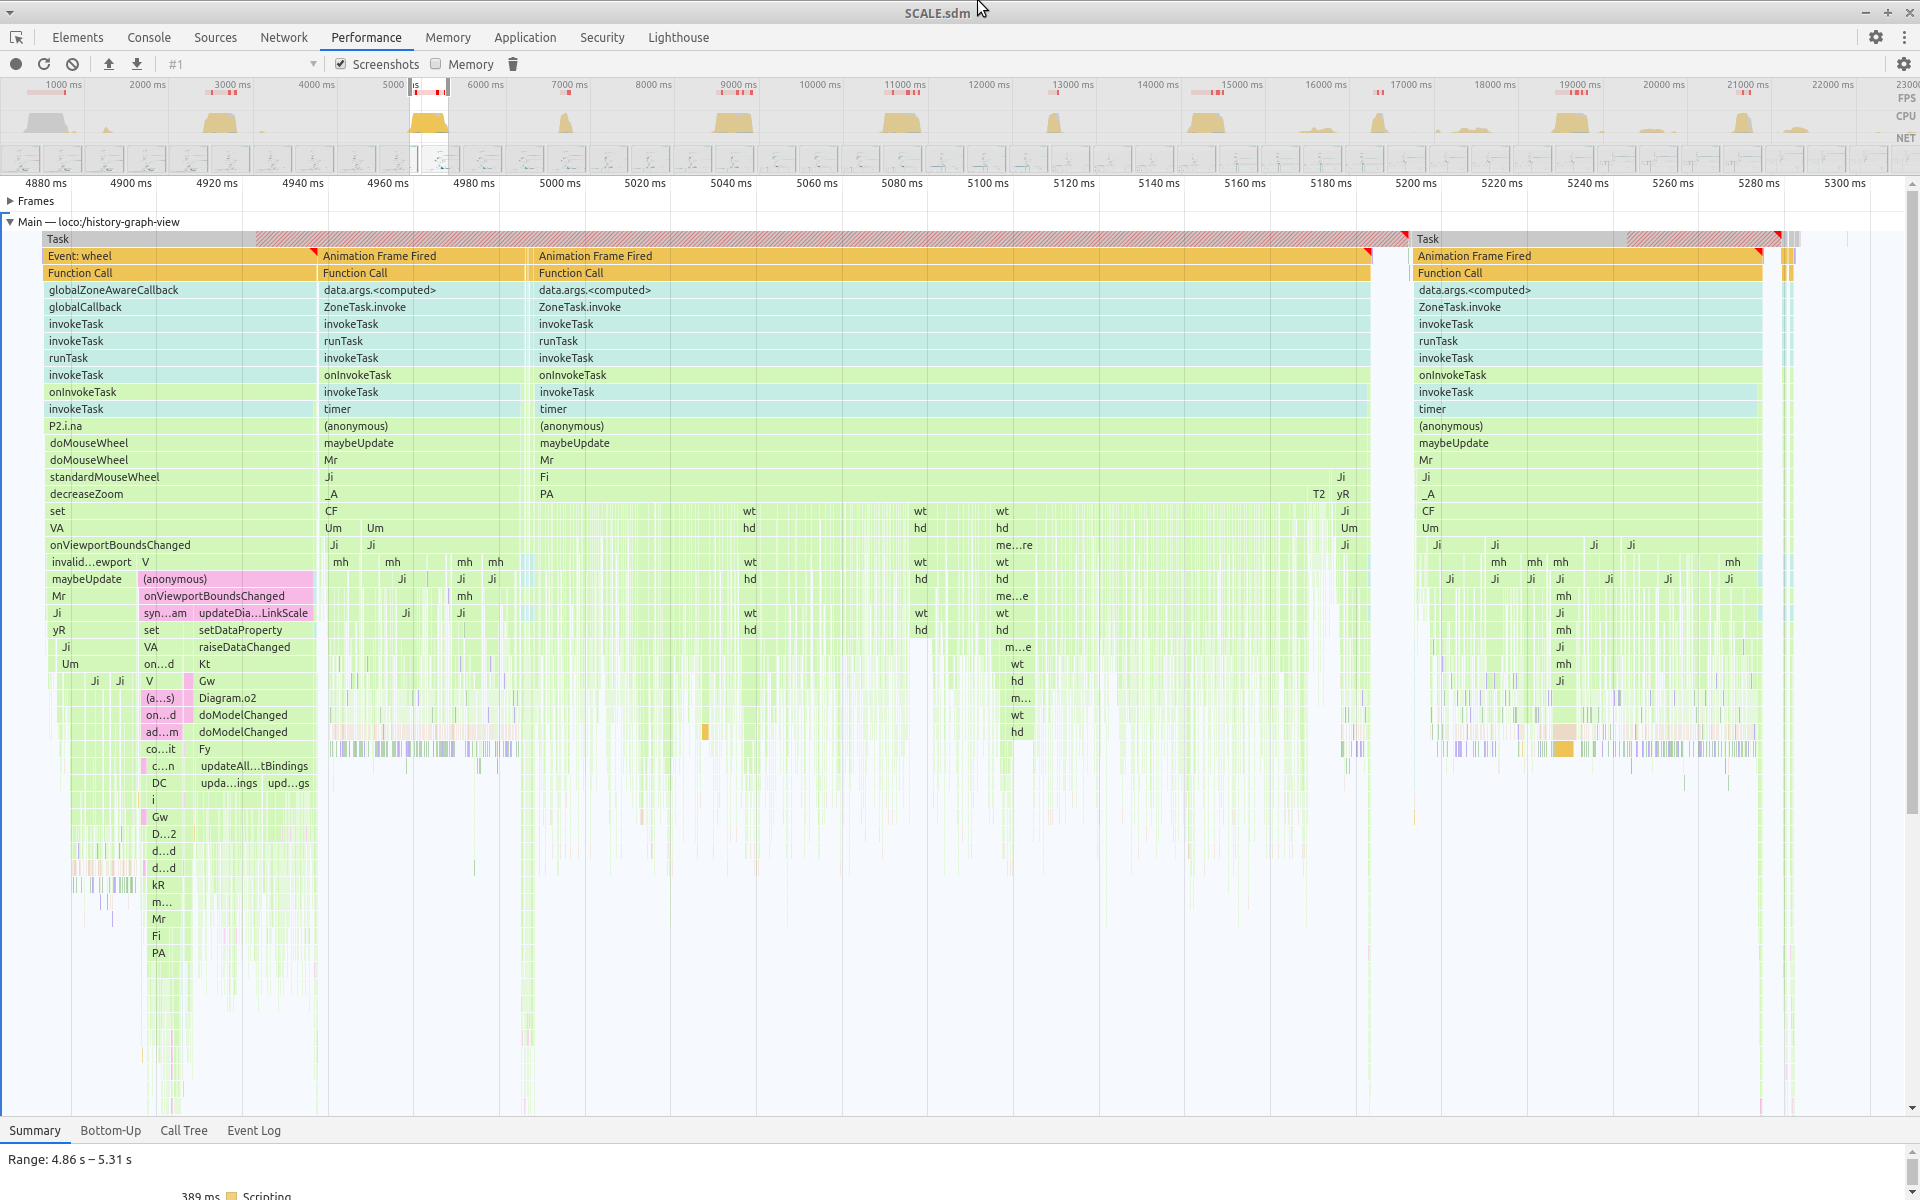
I created the following profile, which suggests that a lot of time goes into updating the model. Please note, that this is an extreme case concerning the runtime. There are also cases where this takes half a second, but I wanted to show a case where every performed step is clearly visible.

Performance decrease zoom

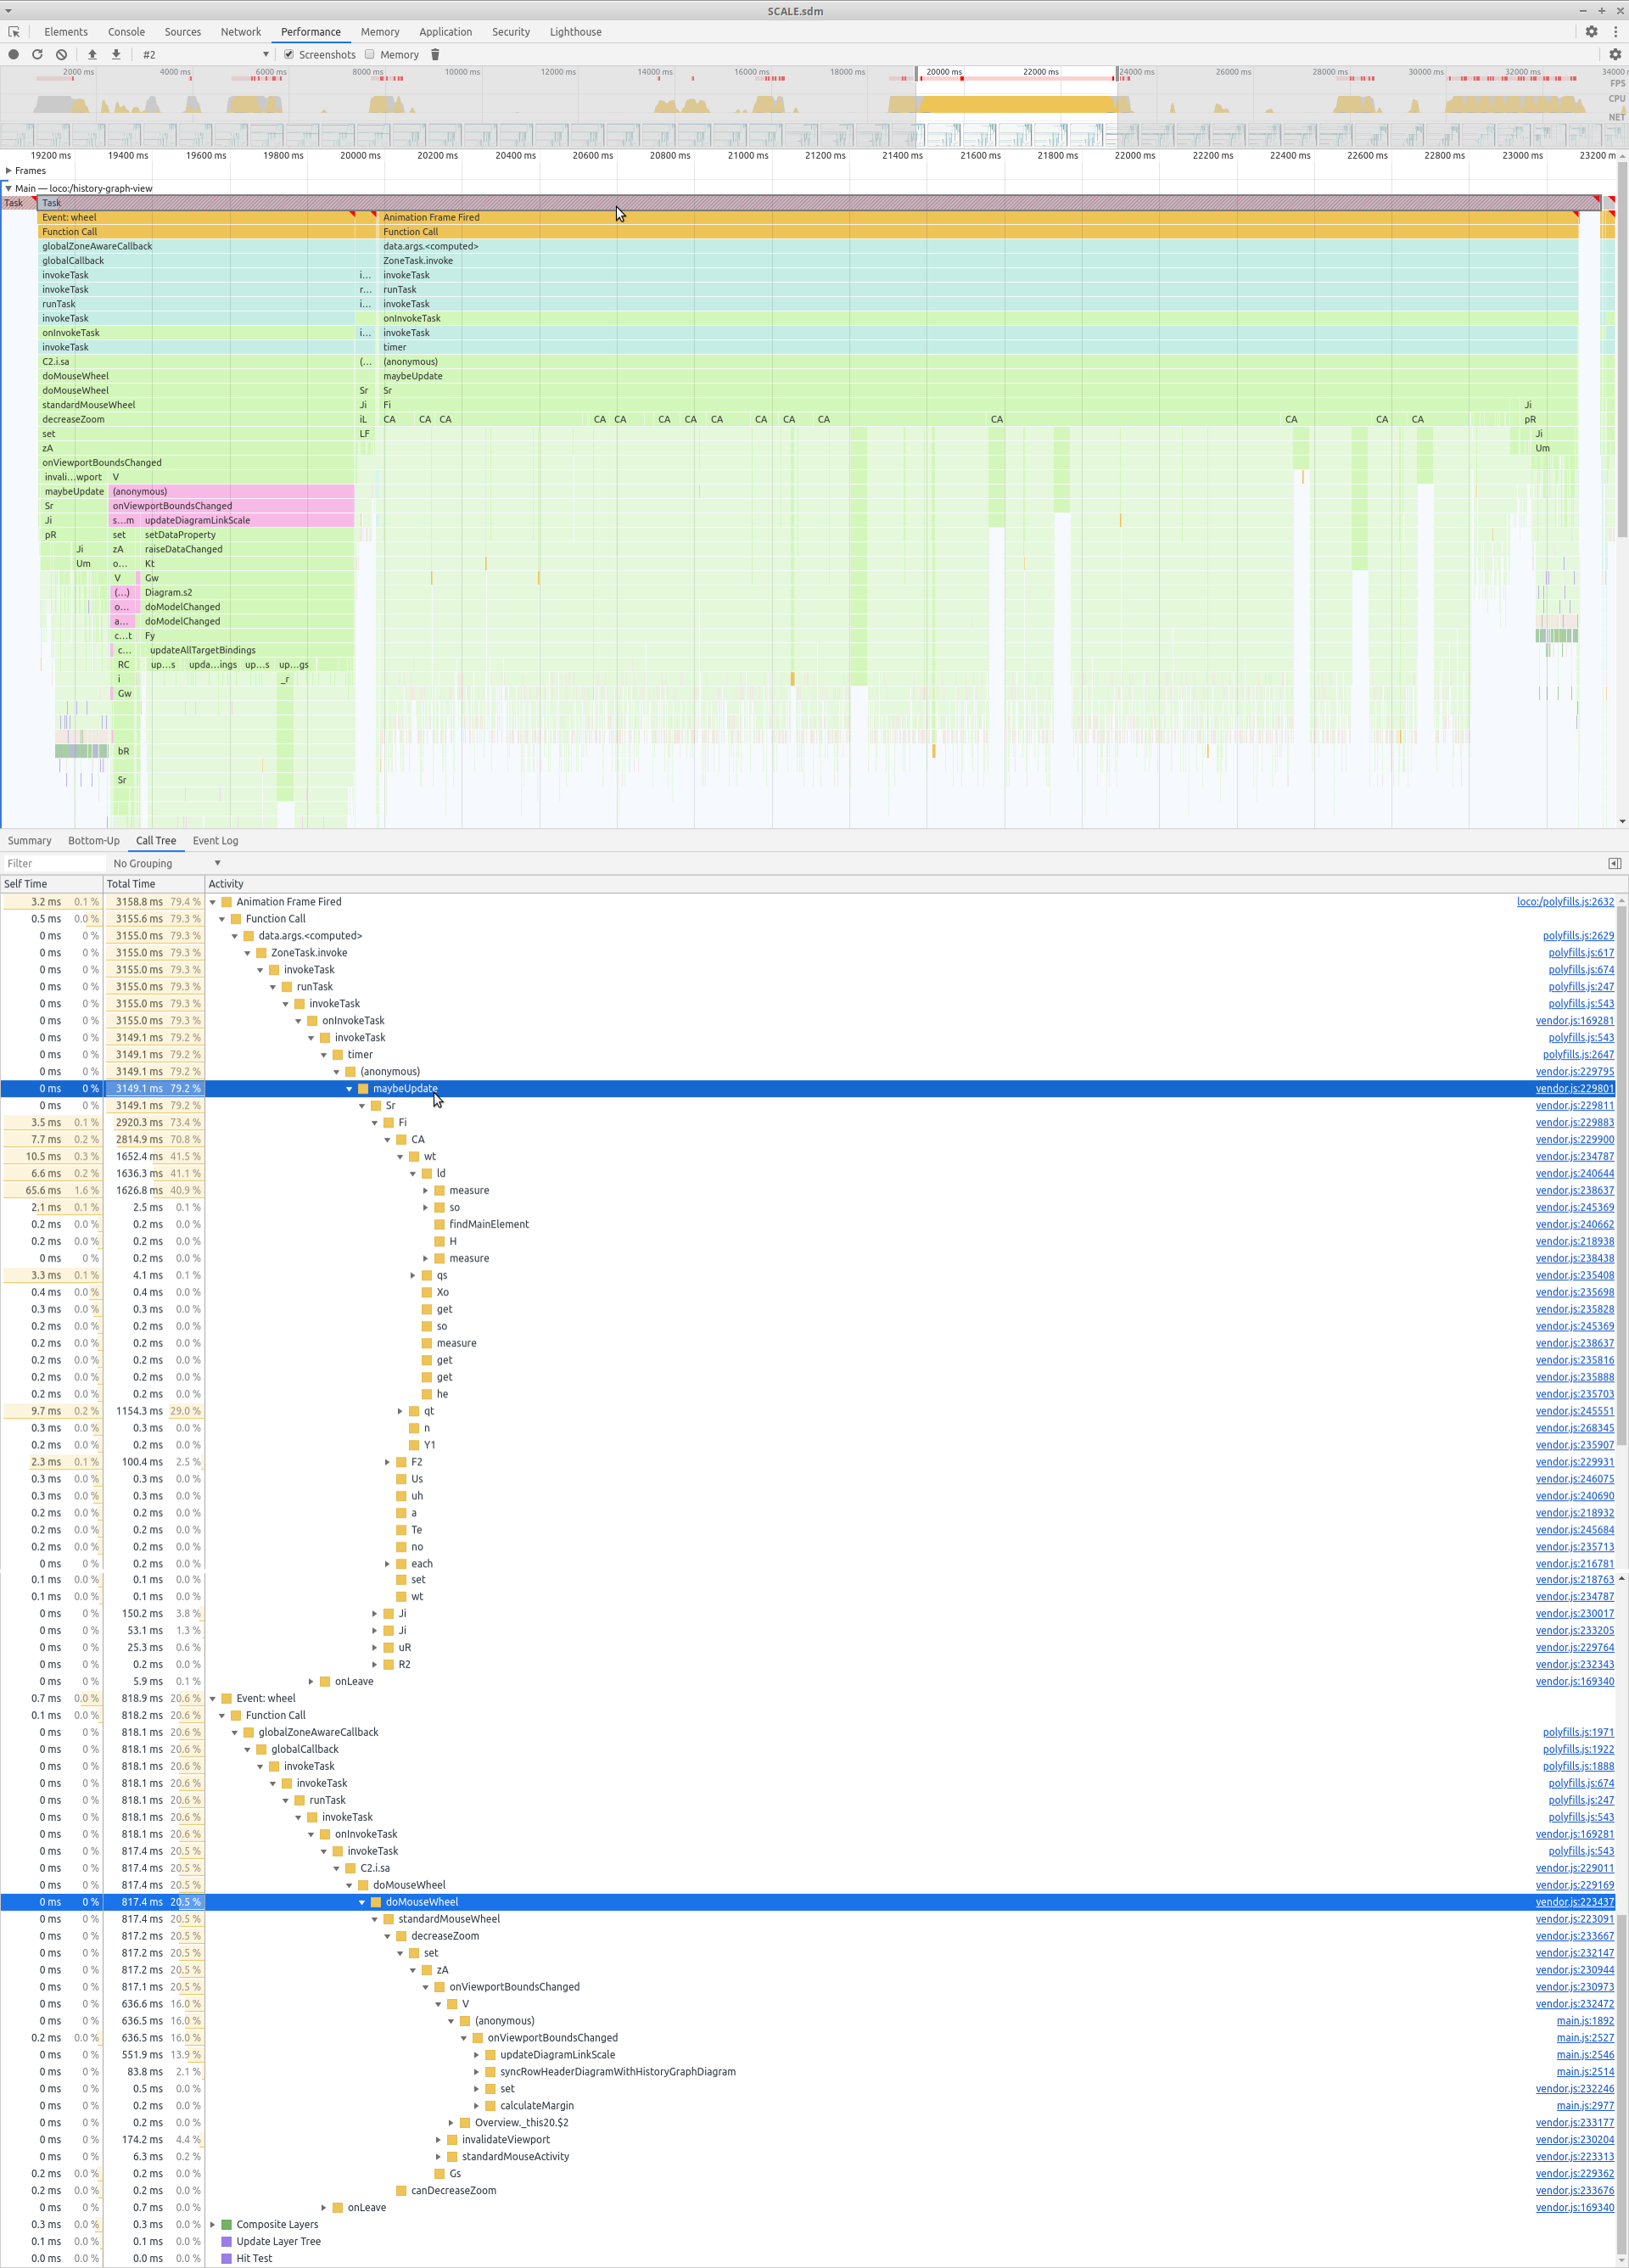
The callbacks for the viewport change that are visible in the profile which I implemented are the following:

onViewportBoundsChanged
  private onViewportBoundsChanged(event: go.DiagramEvent) {
    this.syncRowHeaderDiagramWithHistoryGraphDiagram();

    const oldScale: number = event.subject.scale;
    const newScale: number = this.historyGraphDiagram.scale;
    if (oldScale.toFixed(1) !== newScale.toFixed(1)) {
      // Calculate the padding dependent on the scale. This way, the given target width is
      // always translated into the correct document width.
      // The fixed target width is the width of the filter panel. See the corresponding style sheet.
      // Might be better to get that value from the filter panel component.
      // However, this needs further changes.
      this.historyGraphDiagram.padding = HistoryGraphComponent.calculateMargin(
        500, newScale,
      );

      // Update the link scale when the diagram layout has changed, e.g. when new links were added,
      // so that those links get the diagram link scale.
      this.updateDiagramLinkScale(newScale);
    }
  }
syncRowHeaderDiagramWithHistoryGraphDiagram

// Ensures, that row header diagram and history graph diagram have the same vertical position and scale,
// after the viewport bounds of the history graph diagram have changed.
private syncRowHeaderDiagramWithHistoryGraphDiagram() {
if (this.syncingViewPorts) {
return;
}

this.syncingViewPorts = true;
this.rowHeaderDiagram.scale = this.historyGraphDiagram.scale;
this.rowHeaderDiagram.position = new go.Point(0, this.historyGraphDiagram.position.y + SYNC_DIAGRAMS_POSITION_Y_OFFSET);
this.rowHeaderDiagram.minScale = this.historyGraphDiagram.minScale;
this.rowHeaderDiagram.maxScale = this.historyGraphDiagram.maxScale;
this.syncingViewPorts = false;

}

updateDiagramLinkScale

``
// Update the scale for drawing the links with the given diagram scale.
private updateDiagramLinkScale(scale: number): void {
if (scale > 1) {
// Skip update, since the maximum scale for the links should be 1 in order
// to prevent links getting too wide when zooming closer into the diagram.
return;
}

const model = this.historyGraphDiagram.model as go.GraphLinksModel;
// Update the model property in order to notify the link template that data
// has changed and redrawing is necessary. See also
// https://forum.nwoods.com/t/problem-with-refresh-link-lines-color-and-dashed/5740.
model.setDataProperty(model.modelData, 'diagramLinkScale', scale);

}

// Ensures, that row header diagram and history graph diagram have the same vertical position and scale,
// after the viewport bounds of the row header diagram have changed.
private syncHistoryGraphDiagramWithRowHeaderDiagram() {
if (this.syncingViewPorts) {
return;
}

this.syncingViewPorts = true;
this.historyGraphDiagram.scale = this.rowHeaderDiagram.scale;
this.historyGraphDiagram.position = new go.Point(
  this.historyGraphDiagram.viewportBounds.x, this.rowHeaderDiagram.position.y - SYNC_DIAGRAMS_POSITION_Y_OFFSET
);
this.syncingViewPorts = false;

}

Thanks in advance for your help.

My best,
Manuel

I notice the mention of zones in your screenshot. Are you using Angular? If so, are you running all mouse move event handling outside of the Angular Zone? That avoids a lot of change detection.

If you experimentally change updateDiagramLinkScale to be a no-op, is scrolling or zooming performance good?

Yes.

Not that I am aware of. Events are handled by the tool manager of the diagram.

The performance is increased when making it a no-op.
However, the performance is still lacking, also compared to version 2.3.10, see the profiles below. In general, there seems to be an increase in the task Animation Frame Fired.
Please be aware though, that I did some changes to the code that updates the link scale on the update branch in order to mitigate some performance issues.
Namely, the link scale property was applied to each link before as well as the model.
Furthermore, I no longer update the property within a model transaction but only use the function setDataProperty.

Zooming v2.3.10

Zooming v3.0.8

I will try to add a more comparable example between both versions when I get back to the office tomorrow.

What is this “link scale property” that you modify? In other words, what is your link template that depends on the “diagramLinkScale” property in the Model.modelData object? And has this changed since using GoJS v2.3?

The property factors into the calculation of the stroke width of the link. The goal is to increase the visibility of links when zooming out.
Apart from some adjustments concerning deprecated API and removal of some unneeded code, the template is unchanged.

The template looks as follows:

Link template
// Template for default links with a solid line.
function defaultLinkTemplate(
  identifier: string, curveValue: number, strokeColor: string, selectedStrokeColor: string
): go.Link {
  return new go.Link(
    {
      name: identifier,
      adjusting: go.LinkAdjusting.End,
      layerName: 'Background',
      curve: curveValue,
      corner: 6,
      selectionAdornmentTemplate:
        defaultLinkAdornment(identifier, strokeColor),
    }
  ).add(defaultLinkShape(identifier, strokeColor, selectedStrokeColor));
}

// Shape for default links with a solid line.
function defaultLinkShape(identifier: string, strokeColor: string, selectedStrokeColor: string): go.Shape {
  return new go.Shape(
    {
      name: identifier,
      stroke: strokeColor,
      strokeCap: 'round',
    }
  )
    .bindObject(
      'stroke', 'isSelected', (s) => {
        return s ? selectedStrokeColor : strokeColor;
      }
    )
    .bindObject('strokeWidth', '', calculateLinkShapeStrokeWidth);
}

// Adornment for default links with a solid line.
function defaultLinkAdornment(identifier: string, strokeColor: string): go.Adornment {
  return new go.Adornment(
    'Link',
    {
      layerName: 'Background',
      name: identifier,
    }
  ).add(defaultAdornmentShape(strokeColor));
}

function calculateLinkShapeStrokeWidth(data: go.ObjectData): number {
  const scale = data.diagram ? data.diagram.scale : 1;
  const sanitizedScale: number = sanitizeScale(scale);
  return data.isSelected ? 8 / sanitizedScale : 2 / sanitizedScale;
}

function sanitizeScale(scale: number): number {
  return scale === undefined || scale > 1 ? 1 : scale;
}

Oh, so your link template does not depend on the “diagramLinkScale” property of the Model.modelData shared object?

So what does depend on the “diagramLinkScale” property?

At the moment, the property is no longer used.
Before my attempts to improve performance, however, the property was used in the function that determines stroke width of the link shape:

function calculateLinkShapeStrokeWidth(data: go.ObjectData): number {
  const sanitizedScale: number = sanitizeScale(data.diagramLinkScale);
  return data.isSelected ? 8 / sanitizedScale : 2 / sanitizedScale;
}

Basically what I needed accomplish was forcing an update of the links when the zoom level is changed. For this purpose I resorted to setting the model property.
I got that idea from Problem with refresh link lines color and dashed.

This seemed to be the better approach than just calling raiseDataChanged on the model even though no real data had been changed.

Please let me know if there is a better approach for this.

OK, so if I understand you, you have temporarily(?) removed the functionality you want that thickens the links when the scale is small (zoomed out).

Instead of using a data binding for that, I would just programmatically modify the Shape.strokeWidth as desired, but only when the Diagram.scale changed value from some number greater than some threshold to less than the threshold, or vice-versa. You could have multiple thresholds, if you want. The point is to reduce the frequency in which you change the stroke widths, and when you do it’s more efficient to set the property rather than depend on re-evaluating Bindings.

Philosophically it also less desirable to have a “view” property in the model, but I think that should be a minor consideration – pragmatism should take priority.

Sorry, but no. I just removed updating the property for each link object. The property is still set on the model itself in order to trigger the data changed event and in turn updates the link shape.

Thanks, I will try that.

Yes, in order to reduce the frequency I have the following threshold in place:

    const oldScale: number = event.subject.scale;
    const newScale: number = this.historyGraphDiagram.scale;
    if (oldScale.toFixed(1) !== newScale.toFixed(1)) {

Also, the update is skipped entirely, if the scale is above 1.

  private updateDiagramLinkScale(scale: number): void {
    if (scale > 1) {
      // Skip update, since the maximum scale for the links should be 1 in order
      // to prevent links getting too wide when zooming closer into the diagram.
      return;
    }

I concur.