Sure, here’s the start of your kind of diagram:
<!-- Copyright © Northwoods Software Corporation, 2008-2016. All Rights Reserved. -->

<UserControl x:Class="XYChart.XYChart"
    xmlns="http://schemas.microsoft.com/winfx/2006/xaml/presentation"
    xmlns:x="http://schemas.microsoft.com/winfx/2006/xaml"
    xmlns:go="http://schemas.nwoods.com/GoXam"
    xmlns:local="clr-namespace:XYChart">

  <UserControl.Resources>
    <!-- Node DataTemplates -->
    <go:DataTemplateDictionary x:Key="DTD">

      <!-- the default template -->
      <DataTemplate x:Key="">
        <go:SpotPanel go:Node.Location="{Binding Path=Data.Location}"
                      go:Node.LocationSpot="Center"
                      go:Node.LocationElementName="myCircle"
                      go:Part.SelectionAdorned="True">
          <Ellipse x:Name="myCircle"
                   go:Node.PortId=""
                   Fill="{Binding Path=Data.Color}" Stroke="{x:Null}"
                   Width="8" Height="8" />
          <TextBlock Text="{Binding Path=Data.Text}"
                     FontSize="9"
                     go:SpotPanel.Spot="MiddleTop" go:SpotPanel.Alignment="MiddleBottom">
            <FrameworkElement.RenderTransform>
              <RotateTransform Angle="-45" />
            </FrameworkElement.RenderTransform>
          </TextBlock>
        </go:SpotPanel>
      </DataTemplate>

      <!-- templates for axis labels -->
      <DataTemplate x:Key="LabelY">
        <TextBlock Text="{Binding Path=Data.Text}"
                   FontSize="9"
                   go:Node.Location="{Binding Path=Data.Location}"
                   go:Node.LocationSpot="MiddleRight" />
      </DataTemplate>
      <DataTemplate x:Key="LabelX">
        <TextBlock Text="{Binding Path=Data.Text}"
                   FontSize="9"
                   go:Node.Location="{Binding Path=Data.Location}"
                   go:Node.LocationSpot="MiddleTop" />
      </DataTemplate>

    </go:DataTemplateDictionary>

    <DataTemplate x:Key="LinkTemplate">
      <go:LinkPanel>
        <go:LinkShape Stroke="{Binding Path=Link.FromNode.Data.Color}" />
      </go:LinkPanel>
    </DataTemplate>
  </UserControl.Resources>

  <Grid>
    <go:Diagram x:Name="myDiagram"
                HorizontalContentAlignment="Stretch"
                VerticalContentAlignment="Stretch"
                NodeTemplateDictionary="{StaticResource DTD}"
                LinkTemplate="{StaticResource LinkTemplate}"
                IsReadOnly="True"
                GridVisible="True">
      <go:Diagram.GridPattern>
        <go:GridPattern CellSize="50 100">
          <!-- vertical lines -->
          <Path Stroke="LightGray" StrokeThickness="1"
                go:GridPattern.Figure="VerticalLine" />
          <!-- horizontal lines -->
          <Path Stroke="LightGray" StrokeThickness="1"
                go:GridPattern.Figure="HorizontalLine" />
        </go:GridPattern>
      </go:Diagram.GridPattern>
      <!-- the vertical axis -->
      <go:Node>
        <Line go:Node.Location="0 0"
              X1="0" Y1="0" X2="0" Y2="300"
              Stroke="Black"
              go:Part.Selectable="False" />
      </go:Node>
      <!-- the horizontal axis -->
      <go:Node>
        <Line go:Node.Location="0 300"
              X1="0" Y1="0" X2="300" Y2="0"
              Stroke="Black"
              go:Part.Selectable="False" />
      </go:Node>
    </go:Diagram>
  </Grid>
</UserControl>
And here’s how the model was built in code:
/* Copyright © Northwoods Software Corporation, 2008-2016. All Rights Reserved. */

using System.Collections.ObjectModel;
using System.Windows;
using System.Windows.Controls;
using Northwoods.GoXam.Model;

namespace XYChart {
  public partial class XYChart : UserControl {
    public XYChart() {
      InitializeComponent();

      // create the diagram's data model
      var model = new GraphModel<Dot, int>();
      model.NodesSource = new ObservableCollection<Dot>() {
        // don't use Key==0
        new Dot() { Category="LabelY", Location=new Point(0, 100), Text="VDV\nTLP" },
        new Dot() { Key=1, Location=new Point(10, 100), Text="1" },
        new Dot() { Key=2, Location=new Point(20, 100), Text="2" },
        new Dot() { Key=3, Location=new Point(30, 100), Text="3" },
        new Dot() { Key=4, Location=new Point(50, 100), Text="4" },
        new Dot() { Key=5, Location=new Point(130, 100), Text="5" },
        new Dot() { Key=6, Location=new Point(150, 100), Text="6" },
        new Dot() { Key=101, Location=new Point(50, 50), ToKeys=new ObservableCollection<int>() { 1, 2, 3, 4 } },
        new Dot() { Key=102, Location=new Point(150, 50), ToKeys=new ObservableCollection<int>() { 5, 6 } },

        new Dot() { Category="LabelY", Location=new Point(0, 200), Text="Stopping\nPoint" },
        new Dot() { Key=11, Location=new Point(40, 200), Text="SP(1)", ToKeys=new ObservableCollection<int>() { 12 }, Color="Green" },
        new Dot() { Key=11, Location=new Point(90, 200), Text="SP(2)", ToKeys=new ObservableCollection<int>() { 13 }, Color="Green" },
        new Dot() { Key=11, Location=new Point(120, 200), Text="SP(3)", ToKeys=new ObservableCollection<int>() { 14 }, Color="Green" },
        new Dot() { Key=11, Location=new Point(160, 200), Text="SP(4)", ToKeys=new ObservableCollection<int>() { }, Color="Green" },

        new Dot() { Category="LabelX", Location=new Point(50, 300), Text="500" },
        new Dot() { Category="LabelX", Location=new Point(100, 300), Text="1000" },
        new Dot() { Category="LabelX", Location=new Point(150, 300), Text="1500" },
        new Dot() { Category="LabelX", Location=new Point(200, 300), Text="2000" },
        new Dot() { Category="LabelX", Location=new Point(250, 300), Text="2500" }
      };
      myDiagram.Model = model;
      //this.DataContext = model;
    }
  }

  // the data for each node
  public class Dot : GraphModelNodeData<int> {
    public Dot() {
      this.Location = new Point(0, 0);
    }

    public string Color
    {
      get { return _Color; }
      set
      {
        if (_Color != value) {
          string old = _Color;
          _Color = value;
          RaisePropertyChanged("Critical", old, value);
        }
      }
    }
    private string _Color = "Black";
  }
}
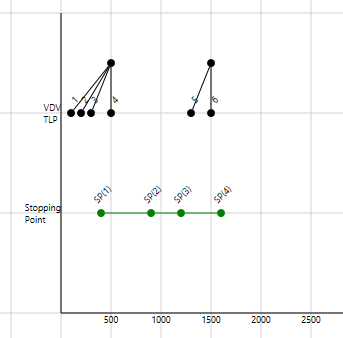
The above code produces this diagram: