Hi Team,
I have created nodes and mapped them as shown in the below code.
import { h, Fragment } from "preact";
import { useEffect, useState } from "preact/hooks";

declare global {
  interface Window {
    go: any;
  }
}

export function GoJsEval() {
  useEffect(() => {
    init();
  }, []); // <-- empty array means 'run once'

  function init() {
    const go = window.go;
    var $ = go.GraphObject.make; // for conciseness in defining templates
    var ml8 = new go.Margin(0, 0, 0, 8);
    var myDiagram = $(
      go.Diagram,
      "myDiagramDiv", // create a Diagram for the DIV HTML element
      {
        "animationManager.isEnabled": false,
        // allow double-click in background to create a new node
        "clickCreatingTool.archetypeNodeData": { text: "Node", color: "white" },
        // allow Ctrl-G to call groupSelection()
        "commandHandler.archetypeGroupData": {
          text: "Group",
          isGroup: true,
          color: "blue",
        },
        // enable undo & redo
        "undoManager.isEnabled": true,
        initialDocumentSpot: go.Spot.Top,
        initialViewportSpot: go.Spot.Top,
        // OR: Scroll to show a particular node, once the layout has determined where that node is
        // "InitialLayoutCompleted": e => {
        //  var node = e.diagram.findNodeForKey(28);
        //  if (node !== null) e.diagram.commandHandler.scrollToPart(node);
        // },
        layout: $(
          go.TreeLayout, // use a TreeLayout to position all of the nodes
          {
            isOngoing: false, // don't relayout when expanding/collapsing panels
            treeStyle: go.TreeLayout.StyleLastParents,
            // properties for most of the tree:
            angle: 90,
            layerSpacing: 80,
            // properties for the "last parents":
            alternateAngle: 0,
            alternateAlignment: go.TreeLayout.AlignmentStart,
            alternateNodeIndent: 15,
            alternateNodeIndentPastParent: 1,
            alternateNodeSpacing: 15,
            alternateLayerSpacing: 40,
            alternateLayerSpacingParentOverlap: 1,
            alternatePortSpot: new go.Spot(0.001, 1, 20, 0),
            alternateChildPortSpot: go.Spot.Left,
          }
        ),
        // automatically show the state of the diagram's model on the page
        //   "ModelChanged": e => {
        //     if (e.isTransactionFinished) {
        //       document.getElementById("savedModel").textContent = myDiagram.model.toJson();
        //     }
        //   }
      }
    );
    function textStyle(field) {
      return [
        {
          font: "12px Roboto, sans-serif",
          stroke: "rgba(0, 0, 0, .60)",
          visible: false, // only show textblocks when there is corresponding data for them
        },
        new go.Binding("visible", field, (val) => val !== undefined),
      ];
    }

    var roundedRectangleParams = {
      parameter1: 2, // set the rounded corner
      spot1: go.Spot.TopLeft,
      spot2: go.Spot.BottomRight, // make content go all the way to inside edges of rounded corners
    };
    // These nodes have text surrounded by a rounded rectangle
    // whose fill color is bound to the node data.
    // The user can drag a node by dragging its TextBlock label.
    // Dragging from the Shape will start drawing a new link.
    myDiagram.nodeTemplate = $(
      go.Node,
      "Auto",
      {
        locationSpot: go.Spot.Top,
        isShadowed: true,
        shadowBlur: 1,
        shadowOffset: new go.Point(0, 1),
        shadowColor: "rgba(0, 0, 0, .14)",
        // selection adornment to match shape of nodes
        selectionAdornmentTemplate: $(
          go.Adornment,
          "Auto",
          $(go.Shape, "RoundedRectangle", roundedRectangleParams, {
            fill: null,
            stroke: "#7986cb",
            strokeWidth: 3,
          }),
          $(go.Placeholder)
        ), // end Adornment
      },
      new go.Binding("location", "loc", go.Point.parse),
      $(
        go.Shape,
        "RoundedRectangle",
        roundedRectangleParams,
        {
          name: "SHAPE",
          fill: "#ffffff",
          strokeWidth: 0,
        },
        // gold if highlighted, white otherwise
        new go.Binding("fill", "isHighlighted", (h) =>
          h ? "gold" : "#ffffff"
        ).ofObject()
      ),
      $(
        go.Panel,
        "Vertical",
        $(
          go.Panel,
          "Horizontal",
          {
            margin: 8,
          },
          //   $(
          //     go.Picture, // flag image, only visible if a nation is specified
          //     {
          //       margin: mr8,
          //       visible: false,
          //       desiredSize: new go.Size(50, 50),
          //     },
          //     new go.Binding("source", "nation", theNationFlagConverter),
          //     new go.Binding("visible", "nation", (nat) => nat !== undefined)
          //   ),
          $(
            go.Panel,
            "Table",
            $(
              go.TextBlock,
              {
                row: 0,
                alignment: go.Spot.Left,
                font: "16px Roboto, sans-serif",
                stroke: "rgba(0, 0, 0, .87)",
                maxSize: new go.Size(160, NaN),
              },
              new go.Binding("text", "text")
            ),
            $(
              go.TextBlock,
              textStyle("appType"),
              {
                row: 1,
                alignment: go.Spot.Left,
                maxSize: new go.Size(160, NaN),
              },
              new go.Binding("text", "appType")
            ),
            $("PanelExpanderButton", "INFO", {
              row: 0,
              column: 1,
              rowSpan: 2,
              margin: ml8,
            })
          )
        ),
        $(
          go.Shape,
          "LineH",
          {
            stroke: "rgba(0, 0, 0, .60)",
            strokeWidth: 1,
            height: 1,
            stretch: go.GraphObject.Horizontal,
          },
          new go.Binding("visible").ofObject("INFO") // only visible when info is expanded
        ),
        $(
          go.Panel,
          "Vertical",
          {
            name: "INFO", // identify to the PanelExpanderButton
            stretch: go.GraphObject.Horizontal, // take up whole available width
            margin: 8,
            defaultAlignment: go.Spot.Left, // thus no need to specify alignment on each element
          },
          $(go.TextBlock, textStyle("info"), new go.Binding("text", "info"))
        )
      )
    );

    myDiagram.linkTemplate = $(
      go.Link,
      { routing: go.Link.AvoidsNodes }, // link route should avoid nodes
      $(go.Shape),
      $(go.Shape, { toArrow: "Standard" })
    );

    // Groups consist of a title in the color given by the group node data
    // above a translucent gray rectangle surrounding the member parts
    myDiagram.groupTemplate = $(
      go.Group,
      "Vertical",
      {
        selectionObjectName: "PANEL", // selection handle goes around shape, not label
        ungroupable: true,
      }, // enable Ctrl-Shift-G to ungroup a selected Group
      $(
        go.TextBlock,
        {
          font: "bold 19px sans-serif",
          isMultiline: false, // don't allow newlines in text
          editable: false, // allow in-place editing by user
        },
        new go.Binding("text", "text").makeTwoWay(),
        new go.Binding("stroke", "color")
      ),
      $(
        go.Panel,
        "Auto",
        { name: "PANEL" },
        $(
          go.Shape,
          "Rectangle", // the rectangular shape around the members
          { fill: "rgba(128,128,128,0.2)", stroke: "gray", strokeWidth: 3 }
        ),
        $(go.Placeholder, { padding: 10 }) // represents where the members are
      )
    );

    // Create the Diagram's Model:
    var nodeDataArray = [
      {
        key: 1,
        text: "App1",
        appType: "App Type 1",
        info: "Information",
        color: "#B2DFDB",
        state: "one",
        loc: "0 0",
      },
      {
        key: 2,
        text: "App 2",
        appType: "Payment Application",
        info: "Payment App",
        color: "#B2B2DB",
        state: "two",
        password: "1234",
        loc: "0 100",
      },
      {
        key: 3,
        text: "A Folder",
        color: "#1DE9B6",
        state: 2,
        group: 7,
        flag: false,
        choices: [1, 2, 3, 4, 5],
      },
      {
        key: 4,
        text: "B Folder",
        color: "#1DE9B6",
        state: 2,
        group: 7,
        flag: false,
        choices: [1, 2, 3, 4, 5],
      },
      {
        key: 5,
        text: "Services",
        color: "#1DE9B6",
        state: 2,
        group: 7,
        flag: false,
        choices: [1, 2, 3, 4, 5],
      },
      {
        key: 6,
        text: "ED Services",
        color: "#00BFA5",
        state: "three",
        flag: true,
      },
      { key: 7, text: "Group 1", color: "#00BFA5", isGroup: true },
      {
        key: 8,
        text: "A Folder",
        color: "#1DE9B6",
        state: 2,
        group: 12,
        flag: false,
        choices: [1, 2, 3, 4, 5],
      },
      {
        key: 9,
        text: "B Folder",
        color: "#1DE9B6",
        state: 2,
        group: 12,
        flag: false,
        choices: [1, 2, 3, 4, 5],
      },
      {
        key: 10,
        text: "Services",
        color: "#1DE9B6",
        state: 2,
        group: 12,
        flag: false,
        choices: [1, 2, 3, 4, 5],
      },
      {
        key: 11,
        text: "ED Services",
        color: "#00BFA5",
        state: "three",
        flag: true,
      },
      { key: 12, text: "Group 2", color: "#00BFA5", isGroup: true },
    ];
    var linkDataArray = [
      { from: 1, to: 5, color: "#5E35B1" },
      { from: 3, to: 4, color: "#6200EA" },
      { from: 3, to: 5, color: "#6200EA" },
      { from: 4, to: 5, color: "#6200EA" },
      { from: 1, to: 6, color: "#5E35B1" },
      { from: 2, to: 10, color: "#5E35B1" },
      { from: 8, to: 9, color: "#6200EA" },
      { from: 8, to: 10, color: "#6200EA" },
      { from: 9, to: 10, color: "#6200EA" },
      { from: 2, to: 11, color: "#5E35B1" },
    ];
    myDiagram.model = new go.GraphLinksModel(nodeDataArray, linkDataArray);

    // some shared model data
    myDiagram.model.modelData = { test: true, hello: "world", version: 42 };

    // select a Node, so that the first Inspector shows something
    myDiagram.select(myDiagram.nodes.first());
  }

  return (
    <Fragment>
      <div
        id="myDiagramDiv"
        style="border: solid 1px black; width:100%; height:800px;"
      ></div>
    </Fragment>
  );
}
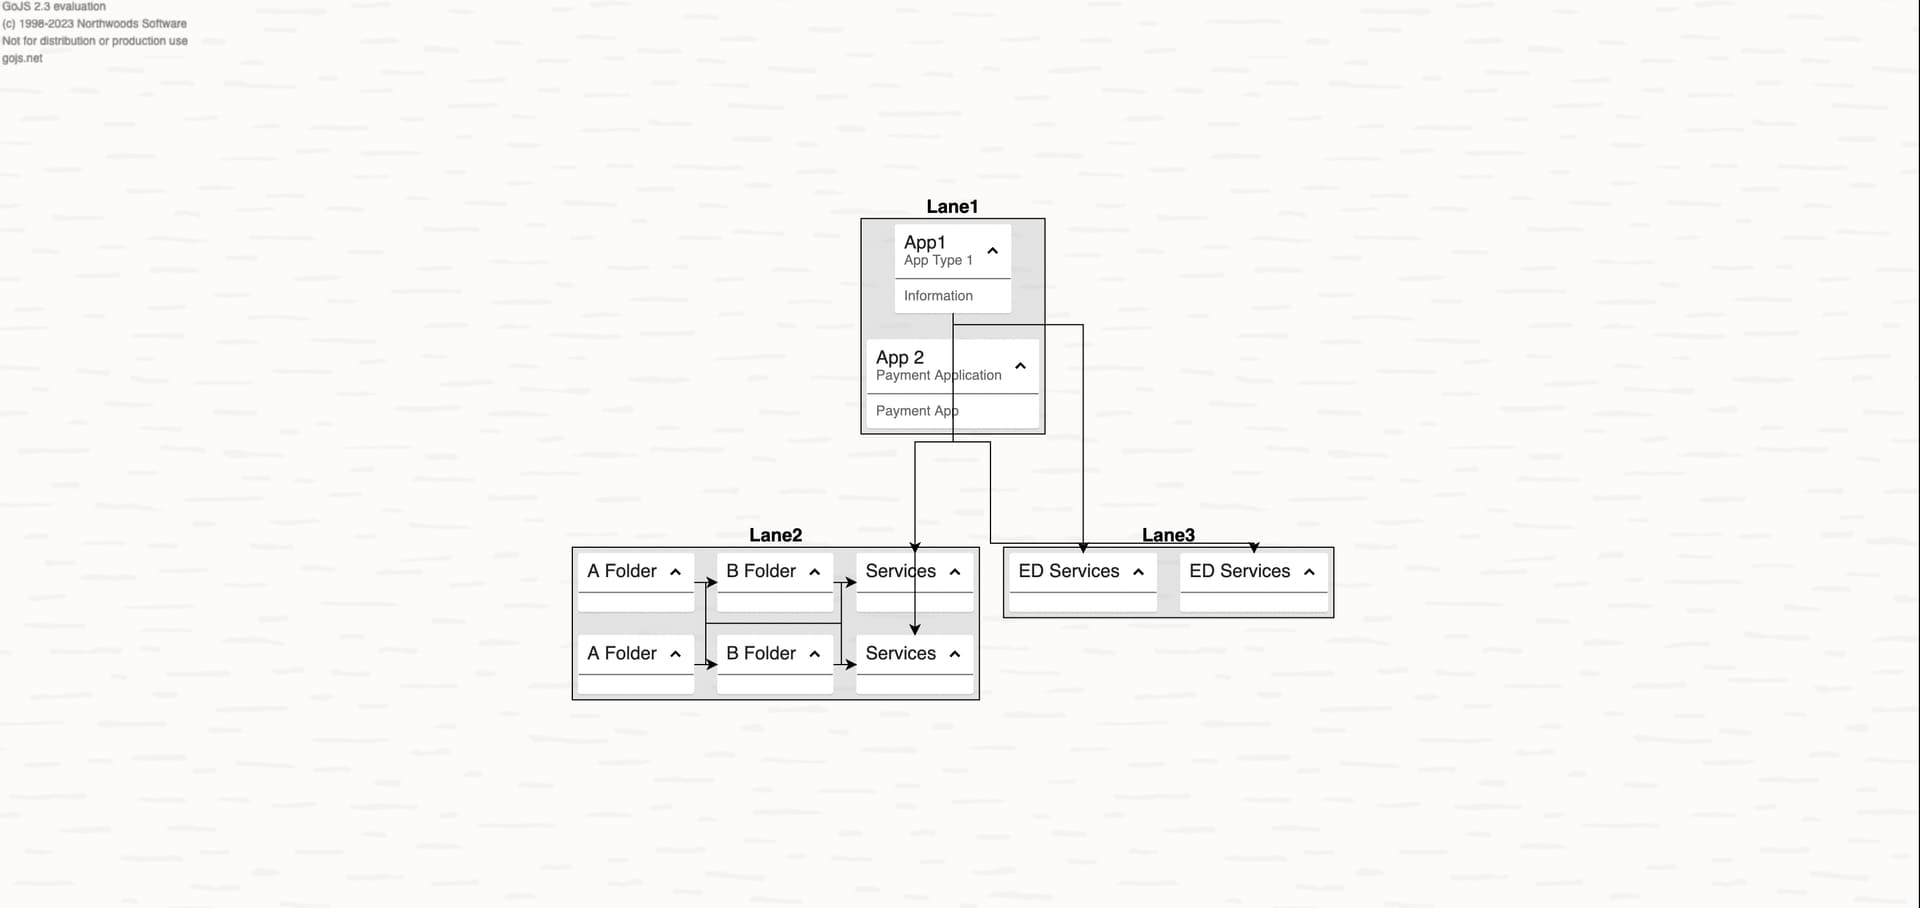
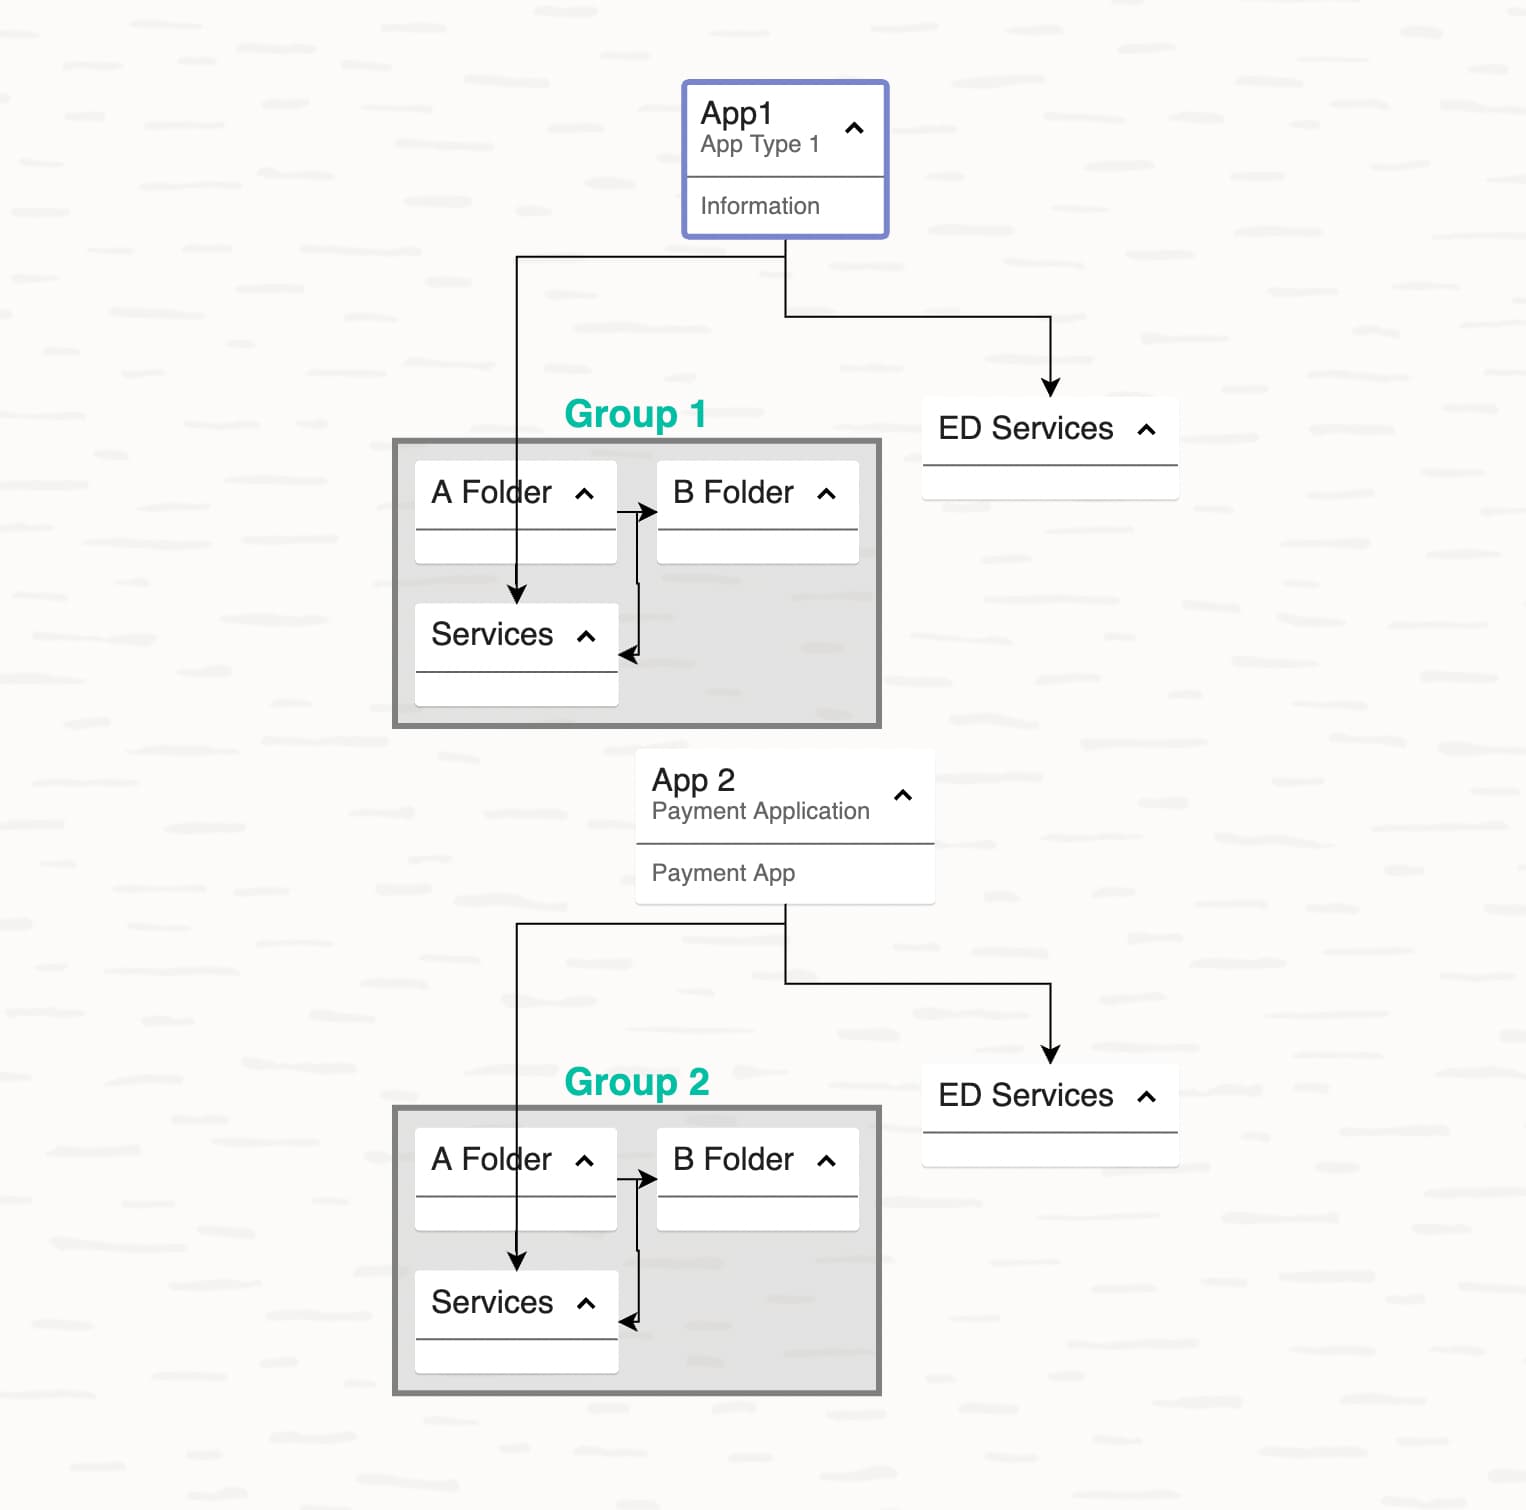
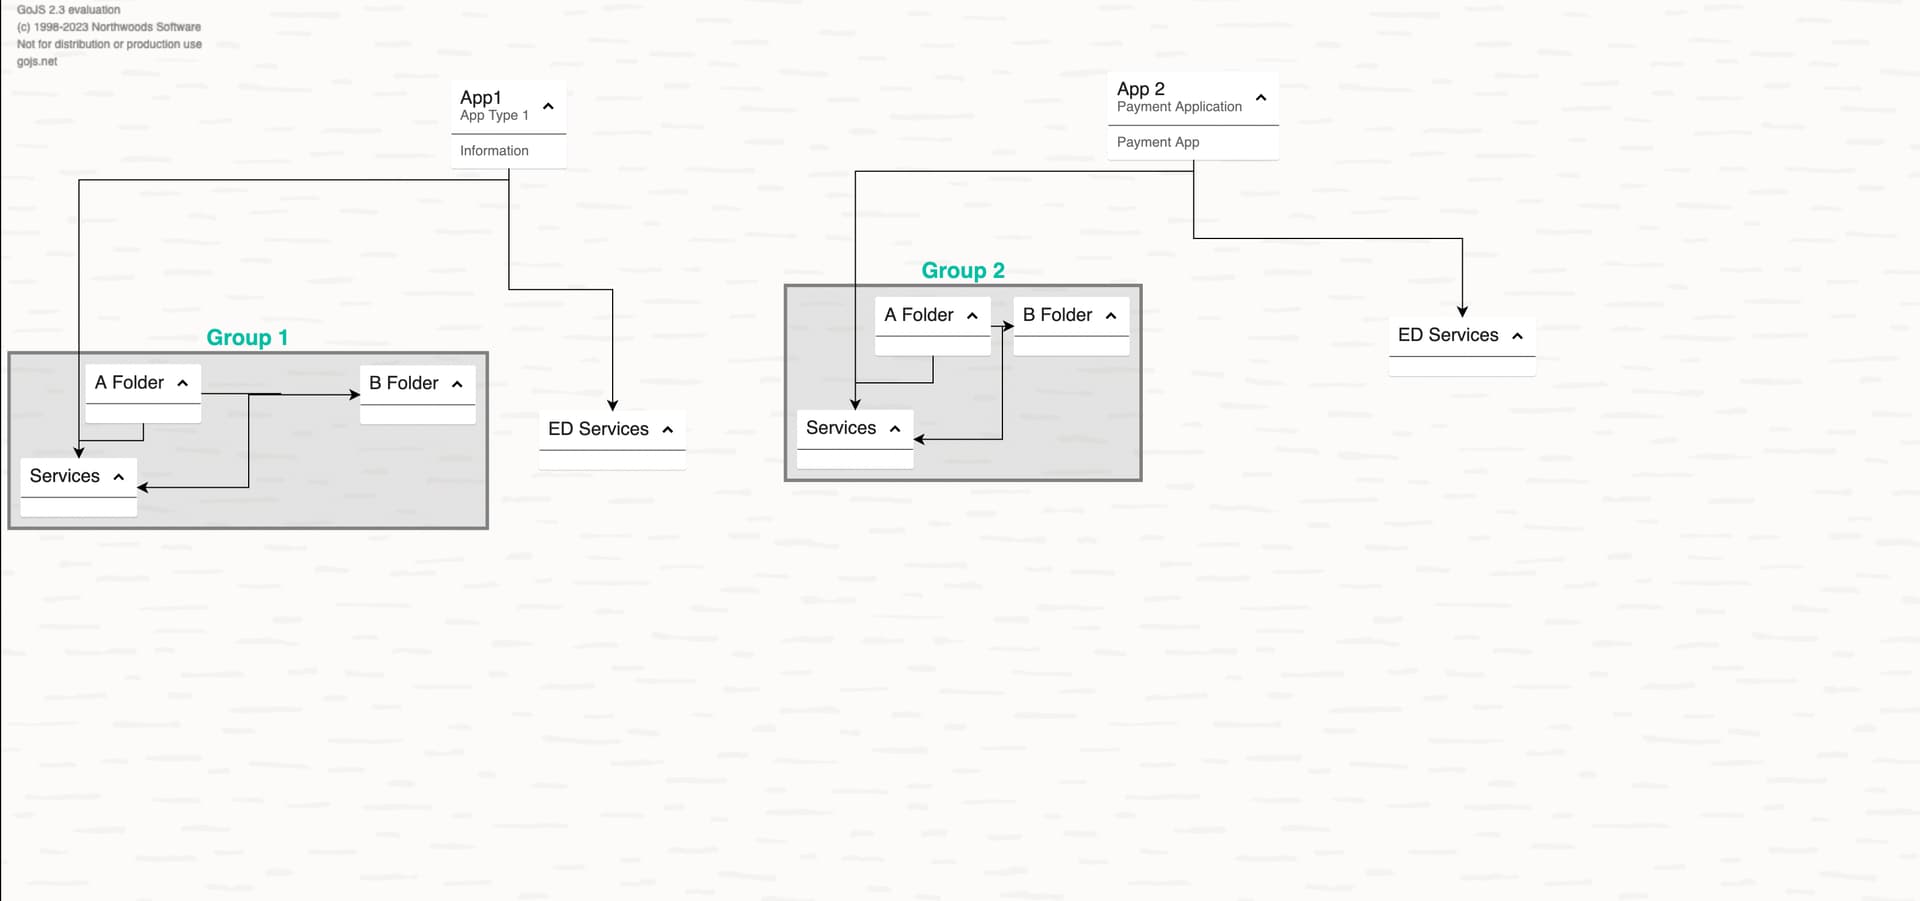
Output:
I need to place App1 and App2 simultaneously. How do we define the position dynamically ?
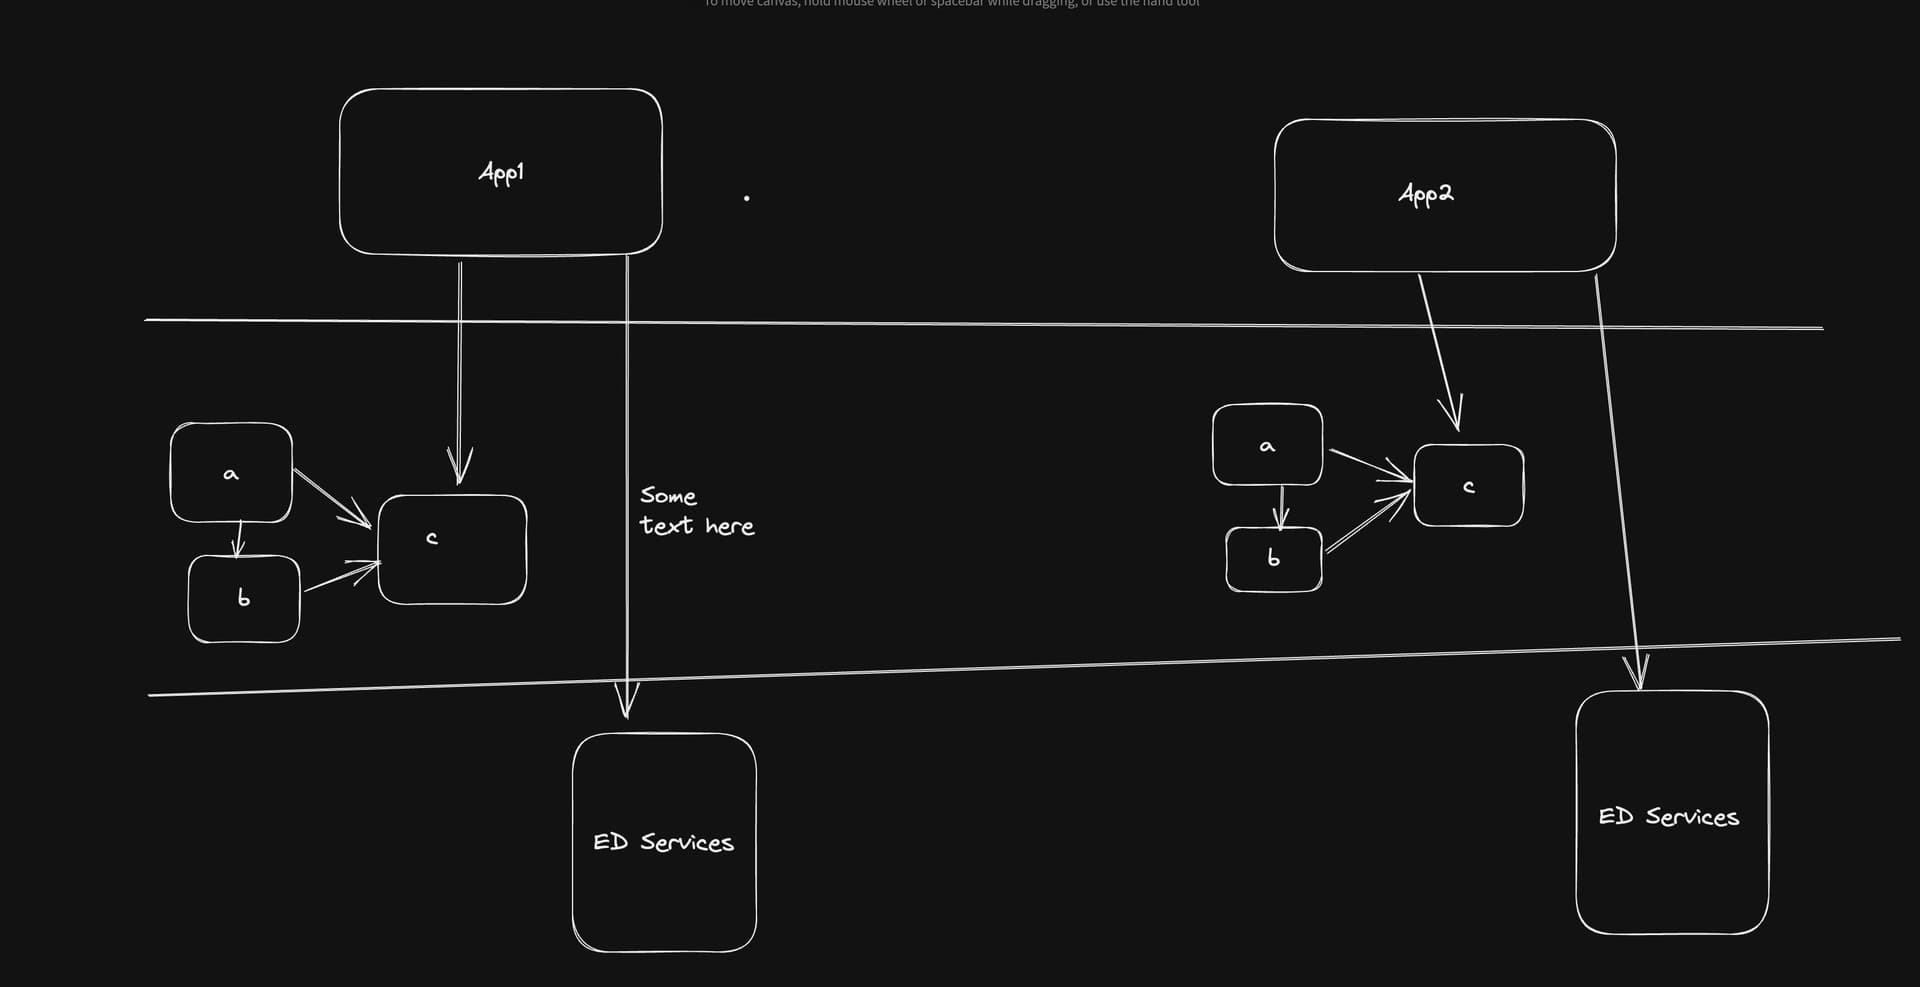
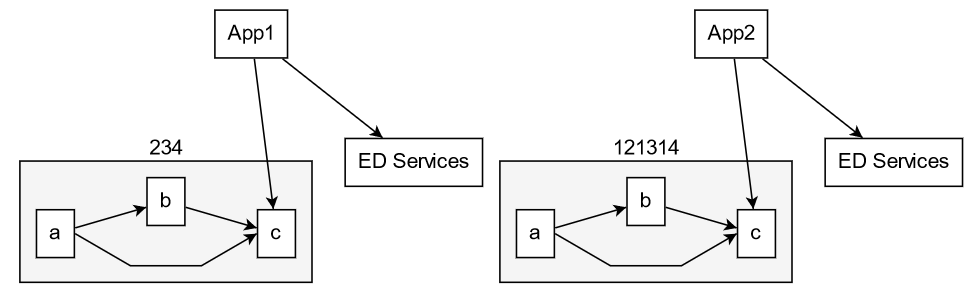
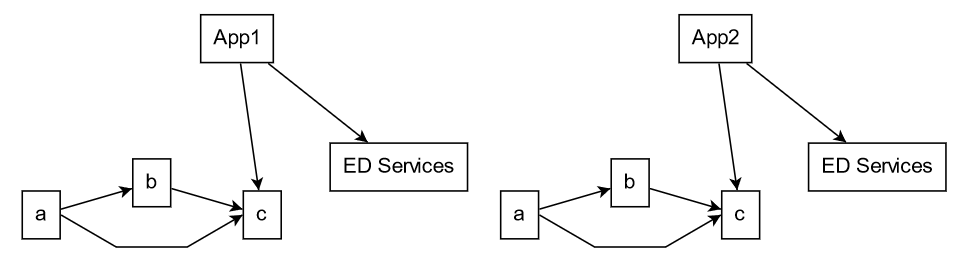
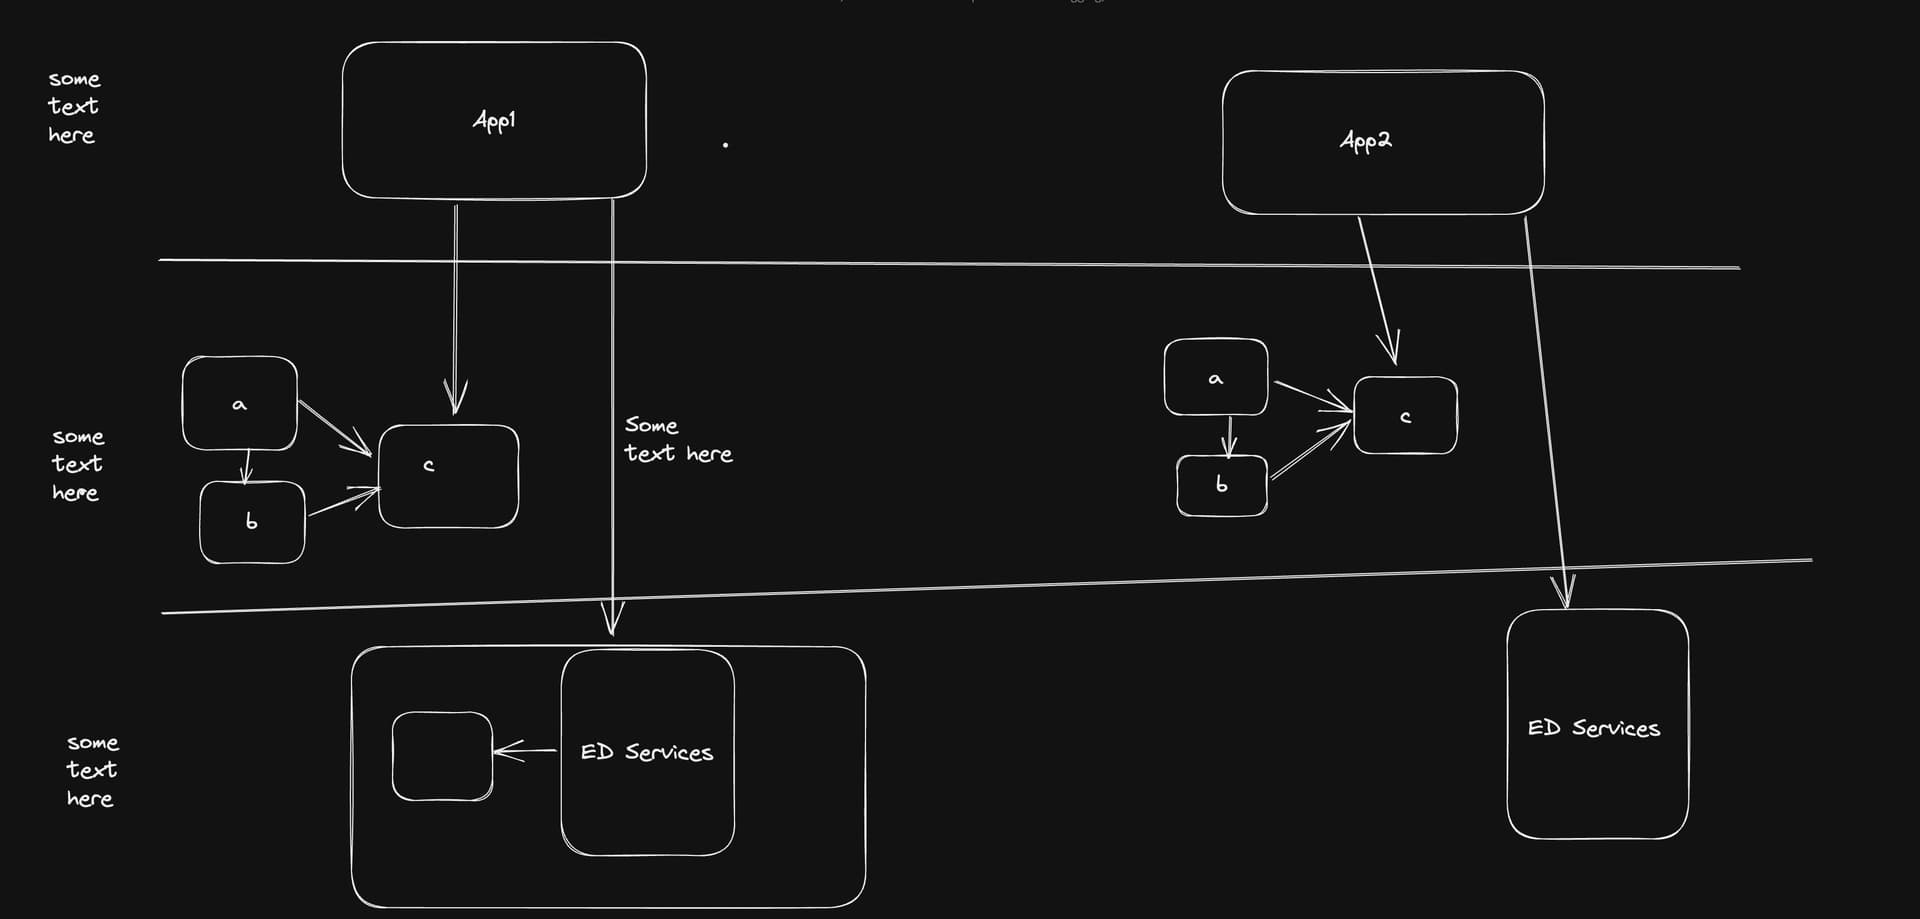
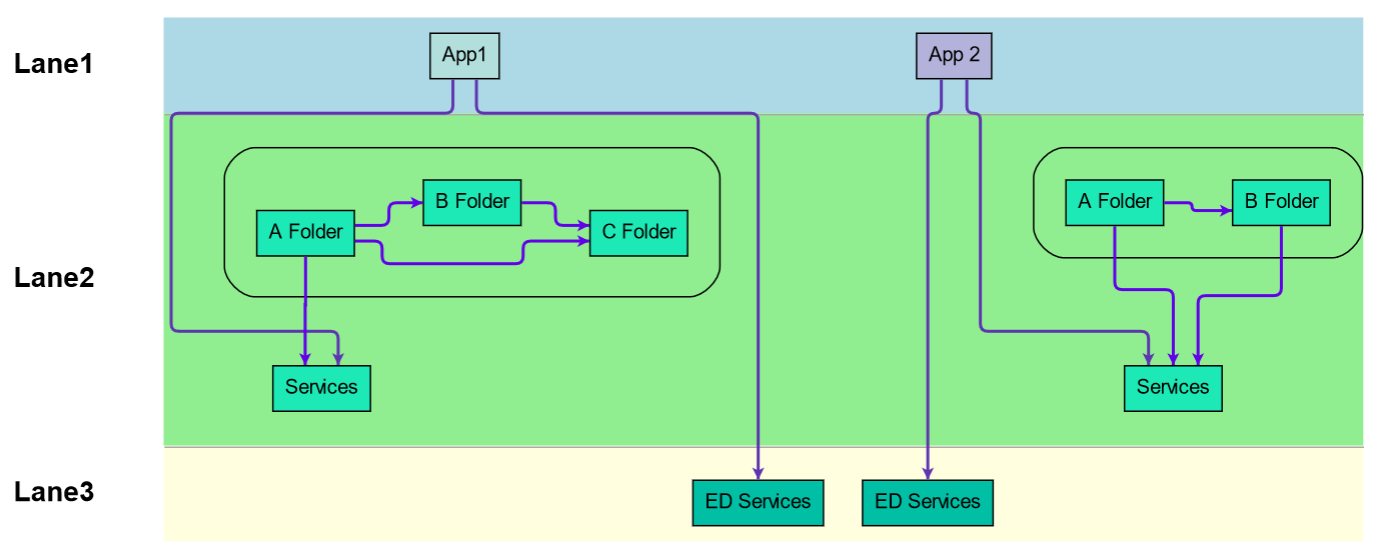
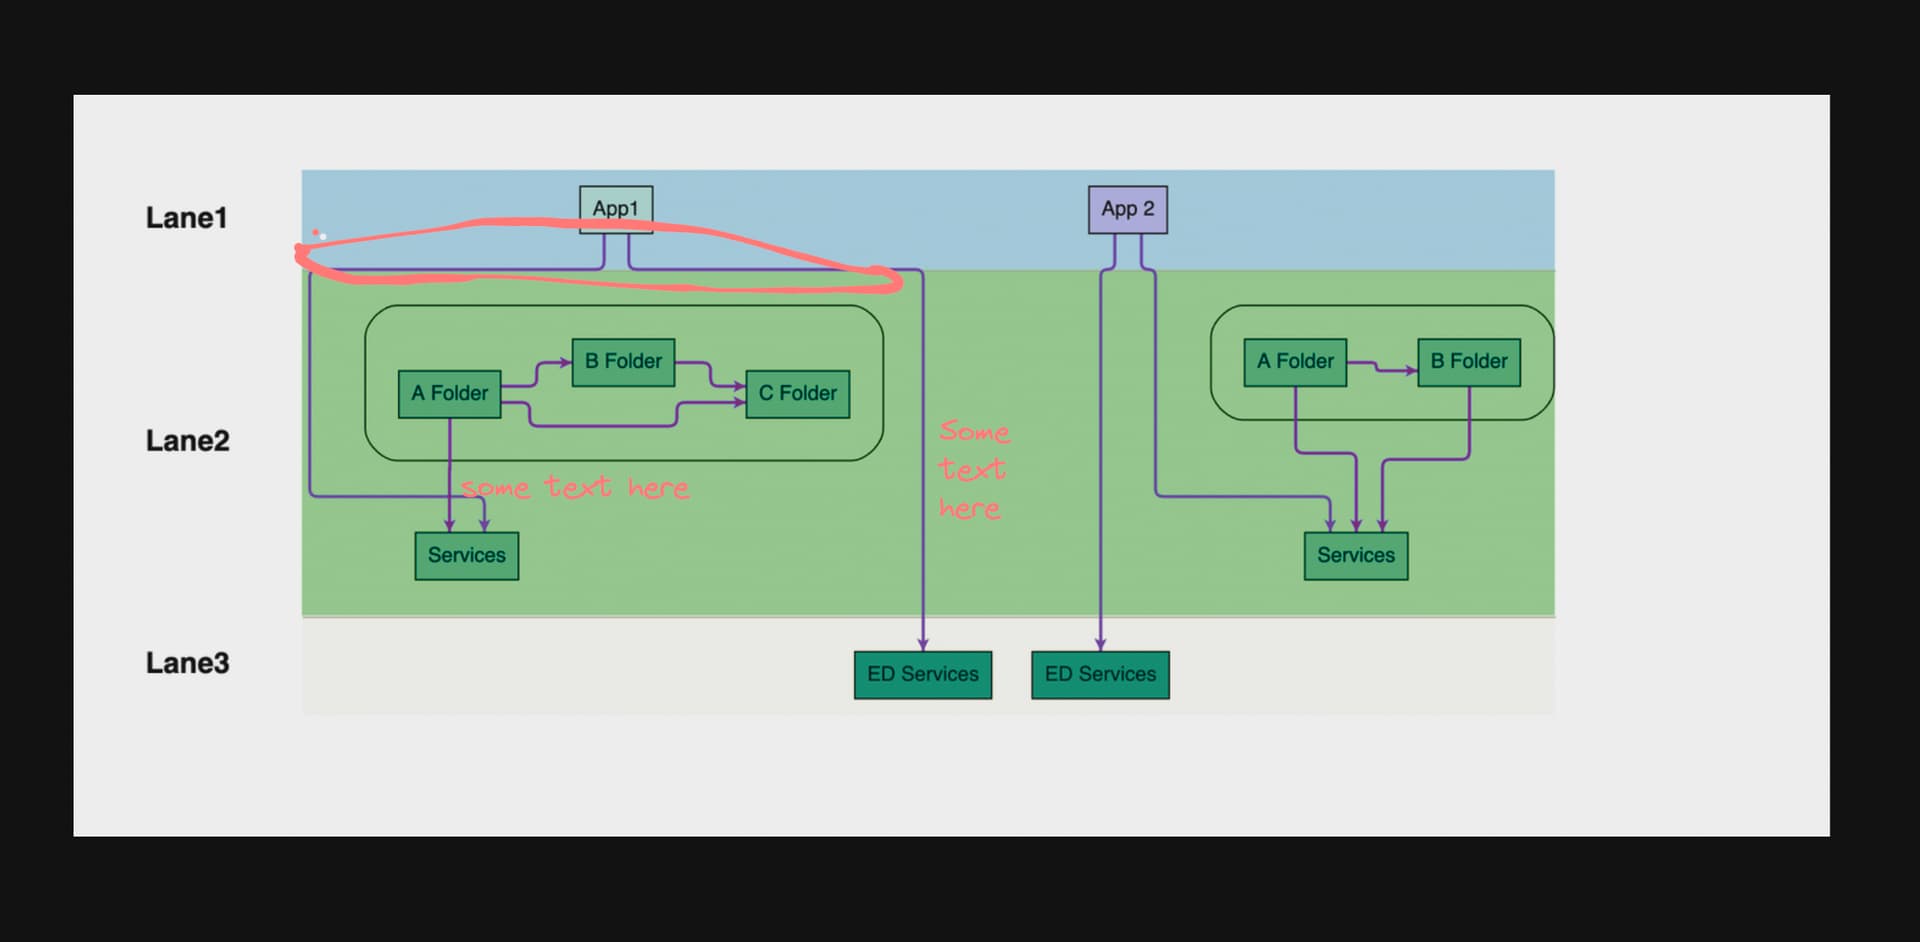
I need something similar to the below images:
Wireframe Requirement: