Re order and save diagram

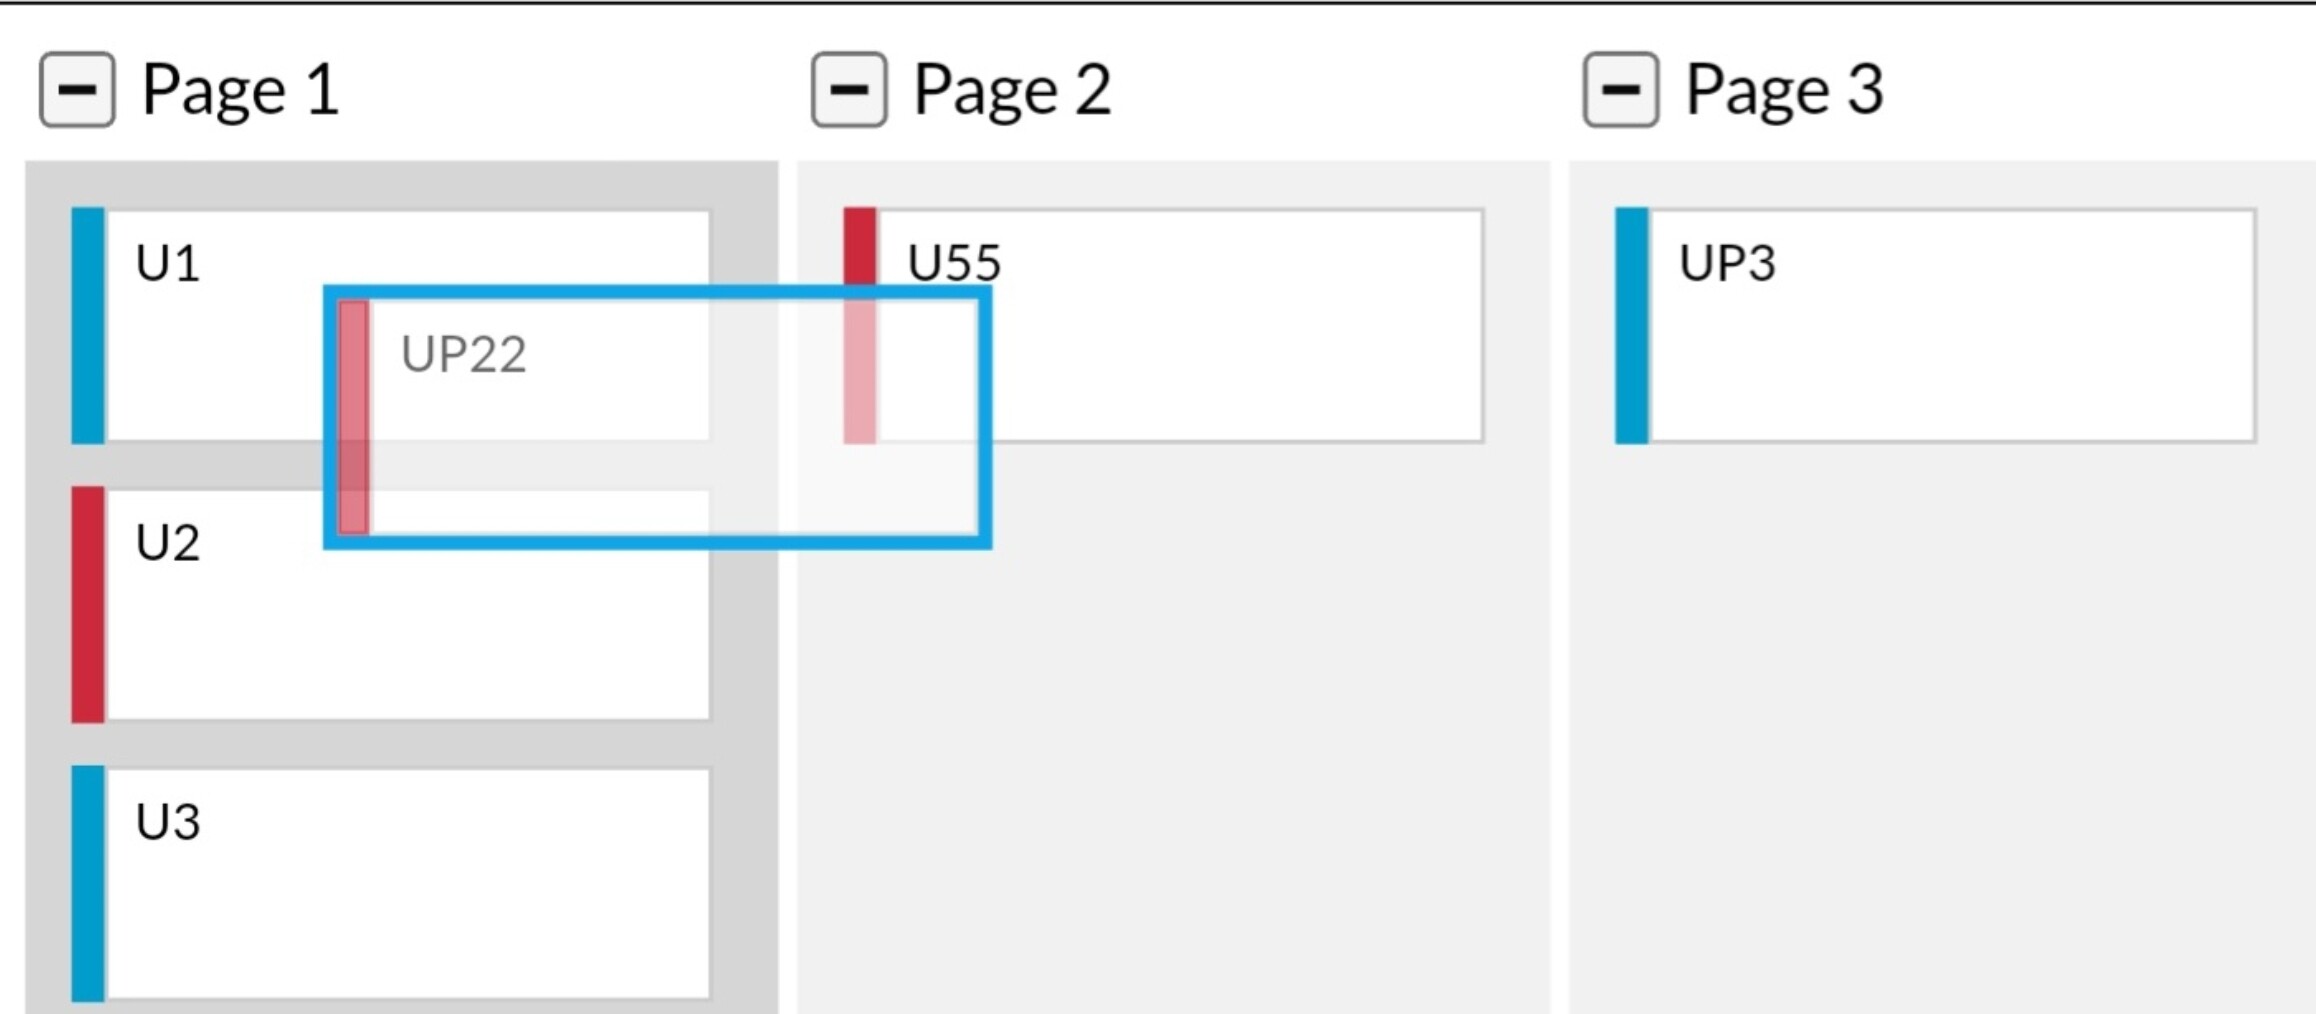
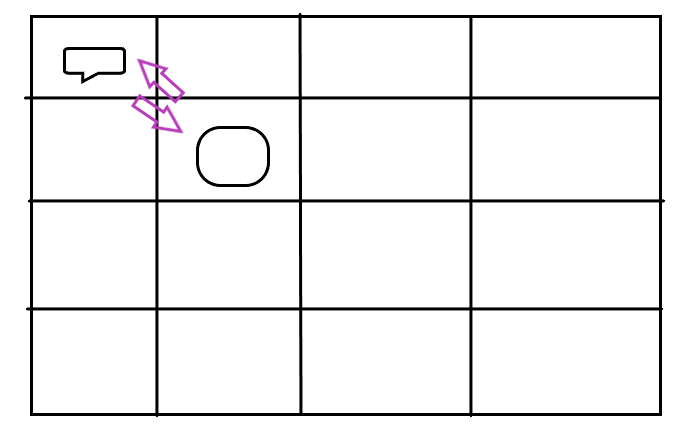
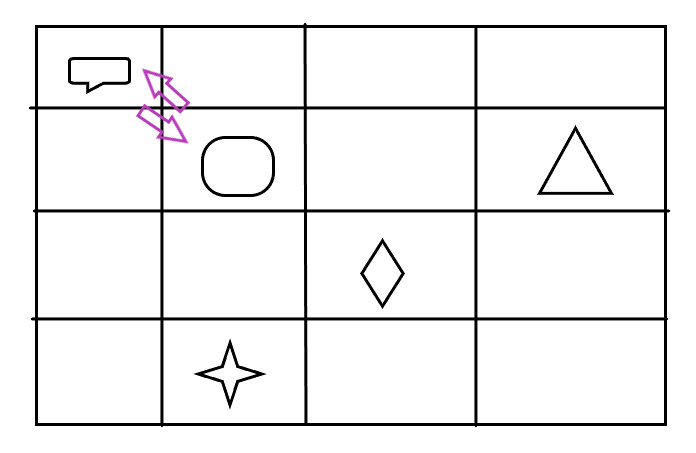
in my diagram view need to re-order or re-arrange and save in 3 pages and each page will have nodes in 4 Rows and 4 Columns… like custom arrangement and user needs to drag and swap the position of 4x4 nodes as per his wish in horizontal or vertical or diagonal and need to save it with changed positions and upon callback should retrieve the same.

public initDiagram(): go.Diagram {
    const $ = go.GraphObject.make;
    let dia = $(go.Diagram, {
      "undoManager.isEnabled": false,
      "animationManager.isEnabled": true,
      // "allowDragOut": false,
      // "allowMove": false,
      // "allowDrop": false,
      "allowVerticalScroll": false,
      "allowHorizontalScroll": false,
      "allowDelete": false,
      "allowCopy": false,
      "allowClipboard": false,
      "allowGroup": false,
      "allowInsert": false,

      model: new go.GraphLinksModel(
        {
          nodeKeyProperty: 'key',
          linkKeyProperty: 'key' // IMPORTANT! must be defined for merges and data sync when using GraphLinksModel
        }
      ),
      layout: $(go.GridLayout,
        {
          spacing: new go.Size(20, 20),  // Adjust spacing as needed         
          wrappingColumn: 4,
          sorting: go.GridLayout.Ascending,
          isRealtime: false,
          comparer: (pa, pb) => {
            var da = pa.data;
            var db = pb.data;
            if (da.key < db.key) return -1;
            if (da.key > db.key) return 1;
            return 0;
          }
        }),
      contentAlignment: go.Spot.TopLeft, // Align the entire diagram content to the top left
    });
    dia.commandHandler.archetypeGroupData = { key: "Group", isGroup: true };
    // dia.toolManager.dragSelectingTool.isEnabled = false;
    dia.nodeTemplate = $(
      go.Node,
      "Vertical",
      {
        resizable: false,
        resizeObjectName: "SHAPE",
      },
      new go.Binding("text", "name"), //for sorting         
      $(
        go.Picture, // flag image, only visible if a nation is specified
        { visible: false, desiredSize: new go.Size(50, 50), margin: 10 },
        new go.Binding("source", "callTypeDialCode", imgTypeConverter),
        new go.Binding("visible", "callTypeDialCode", (nat) => nat !== undefined),
        new go.Binding("desiredSize", "size", go.Size.parse).makeTwoWay(go.Size.stringify)
      ),
      $(
        go.TextBlock,
        {
          alignment: go.Spot.Bottom,
          alignmentFocus: go.Spot.BottomCenter,
          // margin: 2,
          maxSize: new go.Size(160, NaN),
          stroke: "white",
        },
        new go.Binding("text", "name"),
        new go.Binding("stroke", "isHighlighted", h => h ? "darkcyan" : "#ffffff").ofObject(),
        new go.Binding("Border.stroke", "isHighlighted", h => h ? "#5b5b5b" : "#ffffff").ofObject(),
        new go.Binding("font", "isHighlighted", h => h ? "bold 14pt sans-serif" : "12pt sans-serif").ofObject(),
      ),
      {
        toolTip: $(
          "ToolTip",
          { "Border.stroke": "#5b5b5b", "Border.strokeWidth": 2 },
          $(
            go.TextBlock,
            { margin: 8, stroke: "#5b5b5b", font: "bold 16px sans-serif" },
            new go.Binding("text", "name"),
          )
        ),
      },

    ); //END of NODE Template   
    return dia;
  };

And there is no grouping or category like in swim lanes or kanban sample… And am not sure which function is exactly doing this re-ordering in any of the samples in both directions… and only able see the change of node in one direction only… How should I proceed or use or change which function using the above mentioned samples to meet my requirement… Request your guidance or any sample references…

Diagrams do not inherently have any notion of pages – they normally deal with a continuous two dimensional area that is as big as it needs to be to hold its nodes and links. Pages might only be a consideration when printing, and the size and orientation of each page cannot be determined until printing is occurring. How do you want to conceive of pages in your diagram? Using a GridLayout is an easy way to get everything automatically arranged in four columns, but it does not know about pages or about multiples of four rows. If you could provide a sketch or screenshot for how “pages” of four rows should be managed in your diagram, that would help me understand better what you want.

Ok as per your request partial sketch is added here, where each page lane will not be having only column, but will be a grid of 4×4 and my target is to be available for user to re-order and rearrange in page 1 grid between rows to columns initially (auto arrangment is not required) and if possible later between page 1 grids to page 2 grids

As,shown here need to re-order in one page initially from row0column0 to row2column2 and like in kanban the node which is overlapping at row2column2 should be shifted to the row0column0 automatically like comparer function is doing for only 1 row or column… as per below screenshot to shift diagonally and should replace the new commit box with roundedSquare and roundedSquare should be replace with commit box
image

OK, I think I’m better understanding about nodes in your 4x4 grid, but I’m still confused by what you mean with “page”.

You said you do not want to use Groups such as in the Kanban sample. Do you want there to be a huge grid, perhaps 12x12 if there are that many nodes, and you treat movement within each 4x4 subset of the grid specially?

Or do you want something like Groups after all, which allows for users to treat each 4x4 collection as a single unit for movement (if allowed), copying (if allowed), or deletion (if allowed)?

Here’s what I have so far. Until I understand better what a “page” is in your app, I’m ignoring the idea and treating everything as a grid of nodes located by row and column.

Each node is a different color just to make it more obvious after a drop that the stationary node is moved too. Presumably you already know that the details of each node, as determined by the node template(s), don’t really matter to this demo.

<!DOCTYPE html>
<html>
<head>
  <title>Table Layout</title>
  <!-- Copyright 1998-2024 by Northwoods Software Corporation. -->
  <meta name="description" content="Swap cells in TableLayout for dragged node">
  <meta name="viewport" content="width=device-width, initial-scale=1">
</head>
<body>
  <div id="myDiagramDiv" style="border: solid 1px black; width:100%; height:800px"></div>
  <textarea id="mySavedModel" style="width:100%;height:250px"></textarea>

  <script src="https://unpkg.com/gojs"></script>
  <script src="https://unpkg.com/create-gojs-kit/dist/extensions/TableLayout.js"></script>
  <script id="code">
const myDiagram =
  new go.Diagram("myDiagramDiv", {
      layout: new TableLayout(),
      initialAutoScale: go.AutoScale.Uniform,
      "SelectionMoved": e => {
        // get the Node that was moved
        const node = e.subject.first();
        if (!node) return;
        // find which cell it was dropped into
        const dp = e.diagram.lastInput.documentPoint;
        const col = Math.max(e.diagram.layout.findColumnForDocumentX(dp.x), 0);
        const row = Math.max(e.diagram.layout.findRowForDocumentY(dp.y), 0);
        // if the cell has changed, maybe swap node(s) in that cell
        if (node.column !== col || node.row !== row) {
          // move the nodes in this cell to the moved node's original cell
          const nodes = findNodesForCell(col, row);
          nodes.forEach(n => {
            if (n === node) return;
            n.column = node.column;
            n.row = node.row;
          });
          // move the dragged node to the new cell
          node.column = col;
          node.row = row;
        }
        // request a layout to animate moving all nodes to new positions
        node.invalidateLayout();
      },
      maxSelectionCount: 1,
      "undoManager.isEnabled": true,
      "ModelChanged": e => {     // just for demonstration purposes,
        if (e.isTransactionFinished) {  // show the model data in the page's TextArea
          document.getElementById("mySavedModel").textContent = e.model.toJson();
        }
      }
    });

myDiagram.nodeTemplate =
  new go.Node("Auto", { width: 100, height: 100, margin: 2, minLocation: new go.Point(0, 0) })
    .bindTwoWay("row")
    .bindTwoWay("column", "col")
    .bindObject("layerName", "isSelected", s => s ? "Foreground" : "")
    .add(
      new go.Shape({ fill: "white" })
        .bind("fill", "color"),
      new go.TextBlock({ textAlign: "center" })
        .bindObject("text", "", n => `Row: ${n.row}\nCol: ${n.column}`)
    );

function findNodesForCell(c, r) {
  const nodes = [];
  myDiagram.nodes.each(n => {
    if (n.column === c && n.row === r) nodes.push(n);
  });
  return nodes;
}

const data = [];
for (let i = 0; i < 8; i++) {
  for (let j = 0; j < 8; j++) {
    data.push({ row: j, col: i, color: go.Brush.randomColor() });
  }
}
myDiagram.model = new go.GraphLinksModel(data);
  </script>
</body>
</html>

Great, now Need to apply the initail dia.nodeTemplate in the table layout instead of grid layout…
But would like to store and retrieve the grid locations in the sequence form and not with x,y corrdinates… to acheive this request your suggestions or options in gojs.

Please describe your requirements as if I had no idea what you want. Providing a non-trivial example would help, as would screenshots.

Am looking for the grid location to be saved in the sequential manner and to reload in the same positions upon refresh or call back from the respective API instead of gojs documentPoint x and y locations… like for example in the following table layout of 4x 4Grids am expecting to store the
myDiagram.diagram.model.nodeDataArray = [
0: { key: commit box, name: commit box, color: red },
1: { },
2: { },
3: { },
4: { },
5: { key: rounded Square, name: rounded Square, color: green },
6: { },
7: { key: triangle, name: triangle, color: yellow },
8: { },
9: { },
10: { key: diamond, name: diamond, color: white },
11: { },
12: { },
13: { key: star, name: star, color: pink },
14: { },
15: { },
]
And also to be exactly for specific defined 4 or 3 Rows and 3 or 4 Columns in Table Layout in-order to manage the use of locations clearly…
Thanks

Are you saying the order of the node data objects in the nodeDataArray is what determines their row and column? There are no guarantees about the order of data objects in an array with respect to rendering.

I’d recommend using what Walter provided where the row and column are specified in the data. I hope you tried his example and looked at the data changes as nodes are moved between cells.

Yes am working on it in Angular and the extension TableLayout is not available in go.d.ts and noticed that Panel also got Table, TableRow, TableColumn options… further looking on it to apply this extension…

Try using:
https://unpkg.com/create-gojs-kit/dist/extensionsJSM/TableLayout.ts

Thanks Walter… Have imported the extension and did all the requirements for TableLayout and at the end getting error as gojs_extensionsTS_TableLayout__WEBPACK_IMPORTED_MODULE_13__.TableLayout is not a constructor
OR the Table Layout is null and can’t listen to diagram.model Snippet is as below…

Seems all are ok, but getting null in defining the Table Layout diagram, while the layout is Grid am able to see the nodes in diagram view… Request for your help in getting the extension correctly…

<gojs-diagram #keyMap [initDiagram]="initDiagram" [nodeDataArray]="keyDiagramData"
      [divClassName]="diagramDivClassName" [modelData]="state.keyMapModelData"
      [(skipsDiagramUpdate)]="state.skipsDiagramUpdate">     
    </gojs-diagram>
import { TableLayout } from 'gojs/extensionsTS/TableLayout'; 
public tableLayout(rows: number, columns: number): TableLayout {
    const layout = new TableLayout();  
    for (let r = 0; r < rows; r++) {
      layout.getRowDefinition(r);
    }
    for (let c = 0; c < columns; c++) {
      layout.getColumnDefinition(c); 
    }
    layout.defaultAlignment = go.Spot.Center;  
    const partsToLayout = new go.List<go.Part>();
    this.keyDiagramData.forEach((key) => {
      const prt = this.keyMapDiagram.findNodeForKey(key);
      if (prt !== null){
        partsToLayout.add(prt);
      }
    })
    if (partsToLayout.count > 0){
      layout.invalidateLayout()
      layout.doLayout(partsToLayout)
    }
    return layout
  };
public initDiagram(): go.Diagram {
    const $ = go.GraphObject.make;
    // const layout = this.tableLayout(4, 4);
    let dia = $(go.Diagram, {
      "undoManager.isEnabled": false,
      "animationManager.isEnabled": true,

      "allowVerticalScroll": false,
      "allowHorizontalScroll": false,
      "allowDelete": false,
      "allowCopy": false,
      "allowClipboard": false,
      "allowGroup": false,
      "allowInsert": false,

      model: new go.GraphLinksModel(
        {
          nodeKeyProperty: 'key',
          linkKeyProperty: 'key' // IMPORTANT! must be defined for merges and data sync when using GraphLinksModel
        }
      ),
      layout: this.tableLayout(4, 4),

      contentAlignment: go.Spot.TopLeft, // Align the entire diagram content to the top left
    });
    dia.commandHandler.archetypeGroupData = { key: "Group", isGroup: true };
    dia.toolManager.dragSelectingTool.isEnabled = false;
    dia.nodeTemplate = $(
      go.Node,
      "Vertical",
      {
        resizable: false,
        resizeObjectName: "SHAPE",
      },
      new go.Binding("text", "name"), //for sorting         
      $(
        go.Picture, // flag image, only visible if a nation is specified
        { visible: false, desiredSize: new go.Size(50, 50), margin: 10 },
        new go.Binding("source", "callTypeDialCode", imgTypeConverter),
        new go.Binding("visible", "callTypeDialCode", (nat) => nat !== undefined),
        new go.Binding("desiredSize", "size", go.Size.parse).makeTwoWay(go.Size.stringify)
      ),
      $(
        go.TextBlock,
        {
          alignment: go.Spot.Bottom,
          alignmentFocus: go.Spot.BottomCenter,
          // margin: 2,
          maxSize: new go.Size(160, NaN),
          stroke: "white",
        },
        new go.Binding("text", "name"),
        new go.Binding("text", "buttonName"),
        new go.Binding("stroke", "isHighlighted", h => h ? "darkcyan" : "#ffffff").ofObject(),
        new go.Binding("Border.stroke", "isHighlighted", h => h ? "#5b5b5b" : "#ffffff").ofObject(),
        new go.Binding("font", "isHighlighted", h => h ? "bold 14pt sans-serif" : "12pt sans-serif").ofObject(),
      ),
      {
        toolTip: $(
          "ToolTip",
          { "Border.stroke": "#5b5b5b", "Border.strokeWidth": 2 },
          $(
            go.TextBlock,
            { margin: 8, stroke: "#5b5b5b", font: "bold 16px sans-serif" },
            new go.Binding("text", "name"),
            new go.Binding("text", "buttonName"),
          )
        ),
      },

    ); //END of NODE Template   
    return dia;
  };

You should copy the TableLayout code into your project, as we typically recommend with all extensions. Then you can import it however you typically import your local files.

yes able to achieve the swap between cells with TableLayout in a service file, and facing issue to fill up the empty cells with default stroke, width, background. since it is Table Layout… What are the other options available to fill up default for All Cells.
Thanks

 public tableLayout(rows: number, columns: number, nodes): TableLayout {
        const layout = new TableLayout();
       
        for (let r = 0; r < rows; r++) {
            const rowDef = layout.getRowDefinition(r); // This will create a RowColumnDefinition for row r if it doesn't exist
            // rowDef.height = 140;   
            rowDef.separatorStrokeWidth = 22;
            rowDef.alignment = go.Spot.Center;
            rowDef.separatorStroke = '#F1F1F1';
            rowDef.background = "#1a252f";
        }
        for (let c = 0; c < columns; c++) {
            const colDef = layout.getColumnDefinition(c); // This will create a RowColumnDefinition for column c if it doesn't exist            
            // colDef.width = 120;
            colDef.separatorStrokeWidth = 22;
            colDef.alignment = go.Spot.Center;
            colDef.separatorStroke = '#F1F1F1';
            colDef.background = "#1a252f";
        }
        layout.defaultAlignment = go.Spot.Default;

        const partsToLayout = new go.List<go.Part>();
        nodes.forEach((key) => {
            const prt = nodes.findNodeForKey(key);
            if (prt !== null) {
                partsToLayout.add(prt);
            }
        })
        if (partsToLayout.count > 0) {
            layout.invalidateLayout()
            layout.doLayout(partsToLayout)
        }
        return layout
    };

and my component initDiagram is

 public initDiagram(): go.Diagram {
    const $ = go.GraphObject.make;
    let dia = $(go.Diagram, {
      "undoManager.isEnabled": false,
      "animationManager.isEnabled": true,
      "allowVerticalScroll": false,
      "allowHorizontalScroll": false,
      "allowDelete": false,
      "allowCopy": false,
      "allowClipboard": false,
      "allowGroup": false,
      "allowInsert": false,

      layout: this.gojstb.tableLayout(4, 4, this.keyDiagramData),
      contentAlignment: go.Spot.TopLeft, // Align the entire diagram content to the top left
    });
    dia.commandHandler.archetypeGroupData = { key: "Group", isGroup: true };
    dia.toolManager.dragSelectingTool.isEnabled = false;

    dia.groupTemplate = $(go.Group, 'Table', {
      locationObjectName: 'GROUP',
      locationSpot: go.Spot.Center,
      padding: 5,
      layout: $(go.GridLayout, {
        spacing: new go.Size(15, 15), // Adjust spacing as needed
        cellSize: new go.Size(120, 140),
      }),

    },
      $(
        go.Panel, "Auto",
        **$(go.Shape, "RoundedRectangle",**
**          {**
**            fill: "#1a252f", stroke: "#F1F1F1", strokeWidth: 2, name: "cells", background: "#1a252f"**

          }
        ),
      ),
    ), //END of GROUP Template   


      // This template represents a whole "record".
      dia.nodeTemplate = $(
        go.Node,
        "Spot",
        {
          resizable: false,
          resizeObjectName: "SHAPE",
        },   

        $(
          go.Panel, "Vertical",
          { margin: 12 },
          $(
            go.Picture, // flag image, only visible if a nation is specified
            { visible: false, desiredSize: new go.Size(50, 50), margin: 10 },
              ),
          $(
            go.TextBlock,
            {
              alignment: go.Spot.Bottom,
              alignmentFocus: go.Spot.BottomCenter,
              // margin: 2,
              maxSize: new go.Size(160, NaN),
              stroke: "white",
            },
            new go.Binding("text", "key"),        
          ),
        ),
        {
          toolTip: $(
            "ToolTip",
            { "Border.stroke": "#5b5b5b", "Border.strokeWidth": 2 },
            $(
              go.TextBlock,
              { margin: 8, stroke: "#5b5b5b", font: "bold 16px sans-serif" },
              new go.Binding("text", "key"),             
            )
          ),
        },
      ); //END of NODE Template

    dia.model =
      new go.GraphLinksModel(
        {
          nodeKeyProperty: 'key',
          linkKeyProperty: 'key' 
        });

    return dia;
  };

TableLayout doesn’t provide the stroke and background options that PanelLayoutTable does for Panels. That’s something that we have been wanting to implement some day.

Normally I would leave empty table cells empty – in other words make sure that the background shows what you want to see for an empty cell. This option typically requires the use of a separate singleton Part that implements the background. It would need to be adjusted at the end of each TableLayout.

But you could require providing a node data object for each empty cell. Each such Part would look the way that you want an empty cell to look like. This might be required if you want different empty cells to look differently from each other.

ok got it. add Template Map by having category for empty parts - cells and add it to view at All times.