Setting cell spacing in table layout

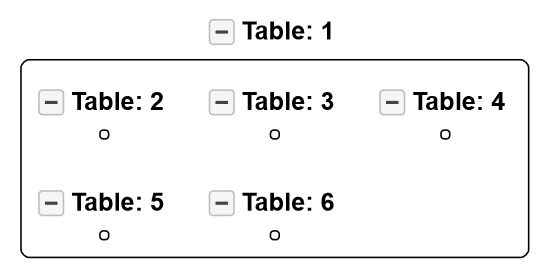
Hi, I have set up a template for table layout, the result of which is shown in the diagram below

The children inside this parent container are also tables themselves, but since they do not have any children themselves, they only appear as green boxes (which is the header for each table group).
I want to know how I can bring them closer together by reducing the spacing between them.

for reference, here is the template that I have defined:

$(gojs.Group, "Vertical", new gojs.Binding("location", "loc", gojs.Point.parse).makeTwoWay(gojs.Point.stringify),
    { 
        layout: $(TableLayout),
        margin: new gojs.Margin(4, 4), 
        padding: new gojs.Margin(8, 4),
        minSize: new gojs.Size(100,50)
    },
    new gojs.Binding("row", "row"),
    new gojs.Binding('column', 'col'),
    new gojs.Binding('columnSpan', 'colSpan'),
    $(gojs.Panel, "Horizontal", // the header
            { defaultAlignment: gojs.Spot.Top, padding: new gojs.Margin(8, 4) },
            $("SubGraphExpanderButton"),  // this Panel acts as a Button
            $(gojs.TextBlock,     // group title near top, next to button
                { font: "Bold 12pt Sans-Serif", margin: new gojs.Margin(0, 4) },
                new gojs.Binding("text", "key", (data) => {
                    return `Table: ${data}`
                })
            ),
        ),
    $(gojs.Panel, "Auto",
        $(gojs.Shape, "RoundedRectangle", { fill: null }),
        $(gojs.Placeholder)
    )
  )

TableLayout doesn’t normally add so much spacing unless the member nodes are wider than they appear to be or unless there’s a reason that it’s stretched horizontally. But I don’t see that in your group template.

I used your group template in a sample and got these results:
image

<!DOCTYPE html>
<html>
<head>
  <title>Minimal GoJS Sample</title>
  <!-- Copyright 1998-2023 by Northwoods Software Corporation. -->
</head>
<body>
  <div id="myDiagramDiv" style="border: solid 1px black; width:100%; height:600px"></div>
  <textarea id="mySavedModel" style="width:100%;height:250px"></textarea>

  <script src="go.js"></script>
  <script src="../extensions/TableLayout.js"></script>
  <script id="code">
const $ = go.GraphObject.make;

const myDiagram =
  $(go.Diagram, "myDiagramDiv",
    {
      "undoManager.isEnabled": true,
      "ModelChanged": e => {     // just for demonstration purposes,
        if (e.isTransactionFinished) {  // show the model data in the page's TextArea
          document.getElementById("mySavedModel").textContent = e.model.toJson();
        }
      }
    });

myDiagram.nodeTemplate =
  $(go.Node, "Auto",
    $(go.Shape,
      { fill: "white" },
      new go.Binding("fill", "color")),
    $(go.TextBlock,
      { margin: 8 },
      new go.Binding("text"))
  );

myDiagram.groupTemplate =
  $(go.Group, "Vertical", new go.Binding("location", "loc", go.Point.parse).makeTwoWay(go.Point.stringify),
    { 
        layout: $(TableLayout),
        margin: new go.Margin(4, 4), 
        padding: new go.Margin(8, 4),
        minSize: new go.Size(100,50)
    },
    new go.Binding("row", "row"),
    new go.Binding('column', 'col'),
    new go.Binding('columnSpan', 'colSpan'),
    $(go.Panel, "Horizontal", // the header
            { defaultAlignment: go.Spot.Top, padding: new go.Margin(8, 4) },
            $("SubGraphExpanderButton"),  // this Panel acts as a Button
            $(go.TextBlock,     // group title near top, next to button
                { font: "Bold 12pt Sans-Serif", margin: new go.Margin(0, 4) },
                new go.Binding("text", "key", (data) => {
                    return `Table: ${data}`
                })
            ),
        ),
    $(go.Panel, "Auto",
        $(go.Shape, "RoundedRectangle", { fill: null }),
        $(go.Placeholder)
    )
  );

myDiagram.model = new go.GraphLinksModel(
[
  { key: 1, isGroup: true },
  { key: 2, isGroup: true, group: 1, row: 0, col: 0 },
  { key: 3, isGroup: true, group: 1, row: 0, col: 1  },
  { key: 4, isGroup: true, group: 1, row: 0, col: 2  },
  { key: 5, isGroup: true, group: 1, row: 1, col: 0  },
  { key: 6, isGroup: true, group: 1, row: 1, col: 1  },
]);
  </script>
</body>
</html>

That sounds right. What do you think is the issue then? These wide spaces are ruining the entire diagram. If I could manually set the spacing to some value, then that should take care of everything.

I have no idea. You can temporarily set the background of each of your node and group templates to be something garish like “lime” or “red” to see if any nodes are bigger than you thought. Also check that you haven’t set any properties or RowColumnDefinitions on the TableLayout.

I haven’t set any additional properties to those which I have already shown in the template provided. To be more precise, the template that I sent earlier is from my backend, where the rendering of the diagram takes place and then the nodes are stored in a database along with their locations properties. The front-end then has a similar template, minus the laying out part, and with additional css. The idea is for the backend to calculate positions of nodes based on the templates set in the backend, and the front-end to have similar templates where the diagram layout is not calculated again, but each group/node is binded to its location property. Here is the template I am using on the front-end:

$(go.Group, "Auto", new go.Binding("location", "loc", go.Point.parse).makeTwoWay(go.Point.stringify),
        $(go.Shape, "RoundedRectangle", { parameter1: 0, fill: "#009688", stroke: "#00897b"}), 
        $(go.Panel, 'Vertical', { padding: 0, },
          $(go.Panel, "Horizontal", // the header
                  { defaultAlignment: go.Spot.Top, padding: new go.Margin(8, 4)},
                  $("SubGraphExpanderButton"),  // this Panel acts as a Button
                  $(go.TextBlock,     // group title near top, next to button
                      { font: "Bold 12pt Sans-Serif", margin: new go.Margin(0, 4) },
                      new go.Binding("text", "", (data) => {
                          return `${data.text}`
                      }),
                  )
            ),
          $(go.Panel, "Auto",
              $(go.Shape, "RoundedRectangle", { fill: null }),
              $(go.Placeholder, { background: "#e0f2f1" })
          )
        )
      )

I have already wrapped a shape around my groups (the green box) so it is visible that the groups are not any wider, but that there is, in fact, empty space around them

It’s good that there’s no Group.layout on the client.

Check that the saved locations really are what you wanted?

Why no Binding for Group.isSubGraphExpanded? Or are they always supposed to start off expanded?

The locations are computed using the first template that I sent earlier. My algorithm dynamically assigns row and column positions for the nodes, and the backend calculates locations based on these properties. The nodes are being placed according to the saved locations, but those locations make for too much cell spacing. There must be something that I could adjust in the backend template which would lay out the nodes closer to each other.
Yes, the nodes are supposed to be expanded, upon initial layout

Are you running your server-side app with Puppeteer?
Server-Side Images with GoJS -- Northwoods Software
Or without?
GoJS in Node.js -- Northwoods Software

If the latter, you’ll need to specify the width and height for the TextBlocks and Pictures.

I am running my server in NodeJs. I do not have Pictures in my diagram, but there definitely are TextBlocks. Do you suggest setting up a maxWidth for these text blocks? I do not want to set a fixed width and height that would make the text inside the blocks to overflow. Just setting up fixed width should bee helpful, I believe.

There is no maxWidth property, but you can set maxSize. GraphObject | GoJS API

Setting the maxSize property on text blocks fixed this cell spacing issue. Thanks