Fundamentally, I need to be able to switch off column separators on rows in a table based on data in my model.
Therefore I am trying to understand how to set RowDefinition information for a table either via binding or code. Any example would be welcomed, as would any other approaches you might suggest.
The case I am working on has a variable number of rows added to a panel.Table as panel.TableRows,then a variable number of cells defined via panle.Auto instances within each row. In the case that a row has no cells, I need to be able to hide the column separators.
So - how to effect attributes of a tablerow based on binding or code please ?
I tried getting the panel.Table’s RowDefinition definition via, for example
var rd = tbl.getRowDefinition(5)
rd.ColumnSeparatorStrokeWidth = 0
but this has no effect and I cannot see a means to put the RowDefinition back, i.e. no panel.Table.getRowDefinition() function ?
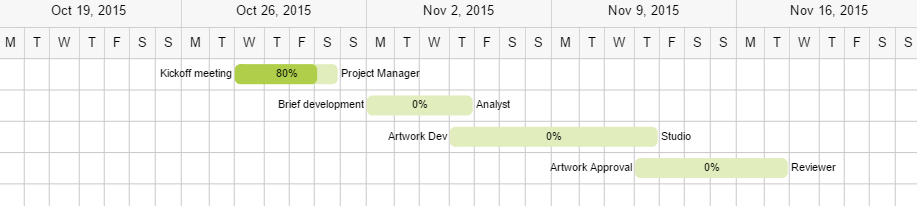
Just to illustrate the point the first image shows what I currently have and the second shows what I want.
Be careful with capitalization. (You might have gotten a warning about that if you are using go-debug.js.)
Bindings should work on RowColumnDefinitions. But I suspect that in your situation you want to limit use of bindings.
Column separators are drawn for the whole length of the column – there is no way not to draw the separator just for one row. But you could set or bind RowColumnDefinition.coversSeparators to true along with some RowColumnDefinition.background in such a case.
Thanks for the reminder on caps - indeed I am enjoying the console warnings from go-debug.js. Shame it can’t pinpoint my misappropriation of commas - that would be a thing.:smile_cat:
Bindings would be fine. Bear in mind though that I am using an item array of rows which I link in the diagram as an itemArray. As far as I can see that means my tables contents are controlled via an itemTempate which points at a template for a panel.TableRow. So where / how would I run the generation of the RowColumnDefinition’s? I can hard code them in the definition for the panel.Table but I am not sure how to bind them to the array because I already used an itemTemplate declaration. Objectively, if I am correct, the RowColumnDefinition is an attribute class of panel.Table to which I have no binding access if I am using an itemArray for the panel.Table contents. Am I missing something ?
FYI - your suggestion for using coverSeparators led me to a solution of having a single cell on those blank rows and setting their columnSpan to fill the width of the row. Works a treat. On one hand I have a solution to the problem of how to achieve the result, however I remain curious about to a binding-based solution would have been coded.
Lastly, yes the chart is looking good now. I had some fun getting the baseline of the % text to line up with the text outside the bars. I also used locationSpot and locationObjectName to position the task bars. Took a couple of hours to work out but appears a robust and pleasing outcome. Moving on to dragging, linking and sizing the task bars next so expect more questions…
Ah, I see. I think you’re right about not being able to create a RowColumnDefinition along with each item, each with its own Binding(s). That is a known restriction. But you can set most of the corresponding properties directly on the item Panel, along with the default property values on the overall Panel, whose property names start with “default…”. That way you could use Bindings on the few fixed RowColumnDefinitions, such as those for the first two rows.
More generally, though, I was thinking it would be simpler to code and probably a bit more efficient if you didn’t use data binding at all for creating the table. Hard to say, and maybe now is too late anyway.
Actually I have found binding and itemArray(s) to be a very viable approach to diagram construction on this project. I had to re-organise my model somewhat to fit in with that approach but my experience is that it is worth thinking about diagram construction from a good model rather than always turning to code first. True, the model is of larger volume than a pure code solution might require but I care more about delivery of the solution than saving a few milliseconds execution time. That said, the build speed for the chart is perfectly acceptable.