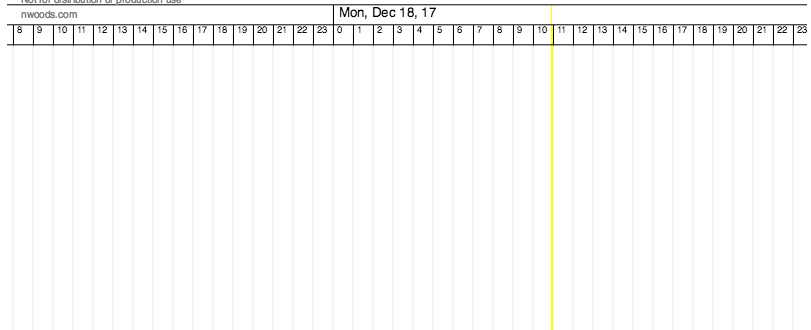
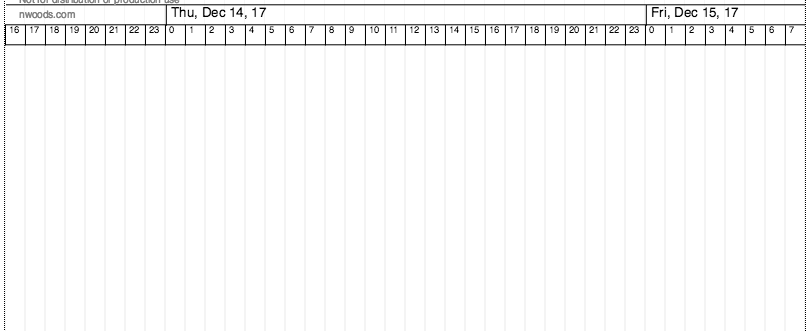
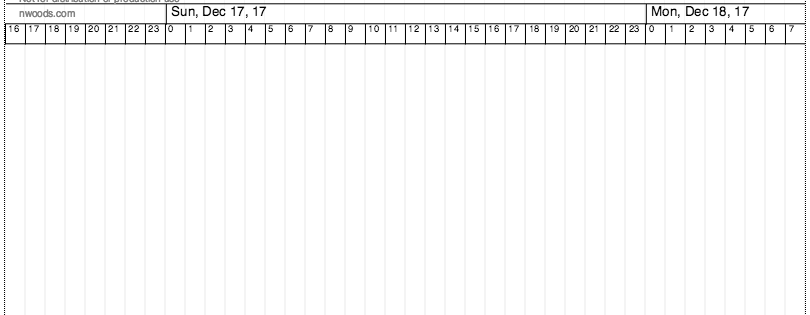
Hi @walter, i am using the code from Rulered Diagram : Diagram with Rulers
My code for creating the timeline is as follows:
myDiagram =
  $(go.Diagram, "myDialogBox",  // create a Diagram for the DIV HTML element
    {
      initialContentAlignment: go.Spot.Center,  // center the content
      "undoManager.isEnabled": false,  // enable undo & redo
      scrollMode: go.Diagram.InfiniteScroll,  // allow the diagram to be scrolled beyond content
      padding: 0,  // scales should be allowed right up against the edges of the viewport
      "grid.visible": false,
      _widthFactor: 1,        // a scale for the nodes' positions and widths
      allowHorizontalScroll: true,
      allowVerticalScroll: false
    });

myDiagram.grid =
    $(go.Panel, "Grid",
      {
        name: "GRID",
        visible: false,
        gridCellSize: new go.Size(20, 70),
        gridOrigin: new go.Point(0, 0)
      },
      $(go.Shape, "LineV", { stroke: "lightgray", strokeWidth: 0.5, interval: 1 })//,
    );

myDiagram.grid.visible = true;  // so that this example shows the standard grid
myDiagram.div.style.background = "white";


// Keep references to the scales and indicators to easily update them
var gradScaleHoriz1 =
  $(go.Node, "Graduated",
    {
      graduatedTickUnit: 20, pickable: false, layerName: "Foreground",
      graduatedMin: 0, graduatedMax: 3600, // 3600 = minutes in 2.5 days
      isInDocumentBounds: false, isAnimated: false
    },
    $(go.Shape, { geometryString: "M0 0 H3600" }),
    $(go.Shape, { name: "DateVLine", geometryString: "M0 0 V20", interval: 24 }),
    $(go.Shape, { geometryString: "M0 0 V20", interval: 1, strokeWidth: 3, stroke: "white" }),
    $(go.TextBlock,
    	{
	      font: "10pt sans-serif", interval: 24, graduatedEnd: .99,
          alignmentFocus: new go.Spot(0, 0, -5, -1),
          graduatedFunction: function (v) {
              var d = new Date();
              d.setHours(0);
              d.setMinutes(0);
              d.setSeconds(0);
              d.setMilliseconds(0);
              d.setDate(d.getDate() + v / 480);
              console.log(d.getDate());
              console.log(d.getDate() + v / 480);
              // format date output to string
              var options = { weekday: "short", month: "short", day: "2-digit", year: "2-digit" };Z
              return d.toLocaleDateString("en-US", options);
          }
    	})
  );

var gradScaleHoriz2 =
      $(go.Node, "Graduated",
        {
    	  graduatedTickUnit: 20, pickable: false, layerName: "Foreground",
          isInDocumentBounds: false, isAnimated: false
        },
        $(go.Shape, { geometryString: "M0 30 H3600" }),
        $(go.Shape, { geometryString: "M0 0 V20", interval: 1 }),
        $(go.TextBlock,
          {
            font: "7pt sans-serif", interval: 1, graduatedEnd: .99,
            alignmentFocus: new go.Spot(0, 0, -3, -1),
            graduatedFunction: function (v) {

              // only show 2, 5, and 7 for each day
              switch (v) {
                case 2:
                case 5:
                case 7:
                  return v.toString();
                default: return "";
              }
              return v.toString();
            }
          }
        )
      );


var gradScaleHoriz3 =
      $(go.Node, "Graduated",
        {
    	  graduatedTickUnit: 20, pickable: false, layerName: "Background",
          isInDocumentBounds: false, isAnimated: false
        },
        $(go.Shape, { geometryString: "M0 60 H3600" }),
        $(go.Shape, { geometryString: "M0 60 V400", interval: 24 })
      );

var gradScaleHoriz4 =
      $(go.Node, "Graduated",
        {
    	  graduatedTickUnit: 20, pickable: false, layerName: "Background",
          isInDocumentBounds: false, isAnimated: false
        },
        $(go.Shape, { geometryString: "M0 0 H3600", stroke: "white" }),
        $(go.Shape, { geometryString: "M0 0 V50", interval: 1, strokeWidth: 3, stroke: "white" })
      );


// Add listeners to keep the scales/indicators in sync with the viewport
myDiagram.addDiagramListener("InitialLayoutCompleted", setupScalesAndIndicators);
myDiagram.addDiagramListener("ViewportBoundsChanged", updateScales);


function setupScalesAndIndicators() {
  var vb = myDiagram.viewportBounds;
  myDiagram.startTransaction("add scales");
  updateScales();
  // Add each node to the diagram
  myDiagram.add(gradScaleHoriz1);
  myDiagram.add(gradScaleHoriz2);
  myDiagram.add(gradScaleHoriz3);
  myDiagram.add(gradScaleHoriz4);
  myDiagram.commitTransaction("add scales");
}

function updateScales() {
  var vb = myDiagram.viewportBounds;
  myDiagram.startTransaction("update scales");
  // Update properties of horizontal scale to reflect viewport
  gradScaleHoriz1.location = new go.Point(vb.x, vb.y+50);
  gradScaleHoriz1.graduatedMin = vb.x;
  gradScaleHoriz1.graduatedMax = vb.x + vb.width;
  gradScaleHoriz1.elt(0).width = vb.width;

  gradScaleHoriz2.location = new go.Point(vb.x, vb.y+70);
  gradScaleHoriz2.graduatedMin = vb.x;
  gradScaleHoriz2.graduatedMax = vb.x + vb.width;
  gradScaleHoriz2.elt(0).width = vb.width;

  gradScaleHoriz3.location = new go.Point(vb.x, vb.y+90);
  gradScaleHoriz3.graduatedMin = vb.x;
  gradScaleHoriz3.graduatedMax = vb.x + vb.width;
  gradScaleHoriz3.elt(0).width = vb.width;

  gradScaleHoriz4.location = new go.Point(vb.x, vb.y);
  gradScaleHoriz4.graduatedMin = vb.x;
  gradScaleHoriz4.graduatedMax = vb.x + vb.width;
  gradScaleHoriz4.elt(0).width = vb.width;
  myDiagram.commitTransaction("update scales");
}