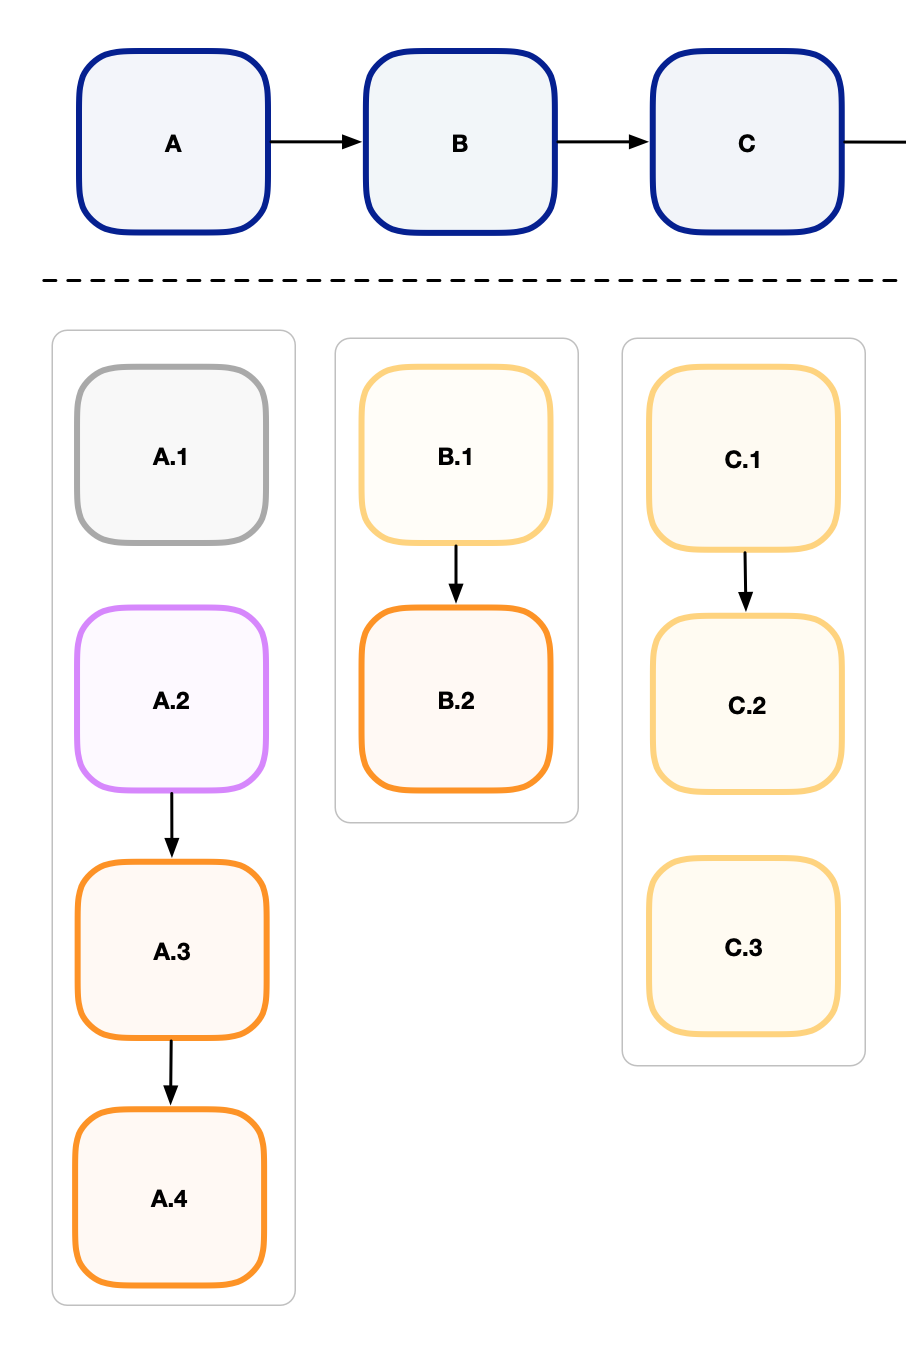
How would you implement this design for a two-tier hierarchical diagram? The parent node for the vertical groups shows above, but there is also a grouping box around the children.
What do you mean “parent node for the vertical groups”? Could you please show the model data that you would want to be represented this way?
The naming of the nodes gives the idea. A is a parent of A.1, A.2, etc.
I created a sandbox at GoJS two-level hierarchy - CodeSandbox that contains the data, but I think I took the wrong approach to support use of links.
I can transform the data into whatever format would be easiest to create the diagram. (In other words, any example that produces the diagram pictured would probably be fine.)
Try this:
  function init() {
    var $ = go.GraphObject.make;

    myDiagram =
      $(go.Diagram, "myDiagramDiv",
          {
            initialContentAlignment: go.Spot.Center,  // for v1.*
            layout: $(go.TreeLayout, { layerSpacing: 20, alignment: go.TreeLayout.AlignmentStart })
        });

    myDiagram.nodeTemplate =
      $(go.Node, "Auto",
        { width: 80, height: 80 },
        $(go.Shape, "RoundedRectangle",
          { parameter1: 15, fill: "white", strokeWidth: 2, portId: "" },
          new go.Binding("stroke", "color"),
          new go.Binding("fill", "color", go.Brush.lighten)),
        $(go.TextBlock,
          new go.Binding("text"))
      );

    myDiagram.groupTemplate =
      $(go.Group, "Vertical",
        { layout: $(go.GridLayout, { wrappingColumn: 1, spacing: new go.Size(30, 30) }) },
        $(go.Panel, "Auto",
          { width: 80, height: 80 },
          $(go.Shape, "RoundedRectangle",
            { parameter1: 15, fill: "white", strokeWidth: 2, portId: "" },
            new go.Binding("stroke", "color")),
          $(go.TextBlock,
            new go.Binding("text"))
        ),
        $(go.Shape, "LineH",
          { strokeDashArray: [6, 4], strokeWidth: 1.5, stretch: go.GraphObject.Horizontal }),
        $(go.Panel, "Auto",
          $(go.Shape, "RoundedRectangle",
            { fill: null, stroke: "lightgray" }),
          $(go.Placeholder,
            { padding: 10 })
        )
      );

    myDiagram.model = new go.GraphLinksModel(
      [
        { key: 100, text: "A", isGroup: true, color: "darkblue" },
        { key: 200, text: "B", isGroup: true, color: "darkblue" },
        { key: 300, text: "C", isGroup: true, color: "darkblue" },
        { key: 101, text: "A.1", group: 100, color: "gray" },
        { key: 102, text: "A.2", group: 100, color: "mediumpurple" },
        { key: 103, text: "A.3", group: 100, color: "goldenrod" },
        { key: 104, text: "A.4", group: 100, color: "goldenrod" },
        { key: 201, text: "B.1", group: 200, color: "moccasin" },
        { key: 202, text: "B.2", group: 200, color: "goldenrod" },
        { key: 301, text: "C.1", group: 300, color: "moccasin" },
        { key: 302, text: "C.2", group: 300, color: "moccasin" },
        { key: 303, text: "C.3", group: 300, color: "moccasin" }
      ],
      [
        { from: 100, to: 200 },
        { from: 200, to: 300 },
        { from: 102, to: 103 },
        { from: 103, to: 104 },
        { from: 201, to: 202 },
        { from: 301, to: 302 }
      ]);
  }
Note that the Model.nodeDataArray has to be a flat Array of Objects, each representing a Node or Group. If you really want to keep the member node data in a property of a group object’s data property, that can be accomplished by creating the flat Array and using references to the actual Objects in your original data structures. However adding and removing member nodes to and from groups would require additional work to make sure they update the correct Arrays in your original data structures.
Also, I wasn’t sure about that dashed line. You could certainly draw a single dashed line as a separate Part that was independent of any Group, but then you’d have to make sure it had the correct length and was positioned correctly relative to the Groups.
The result is:
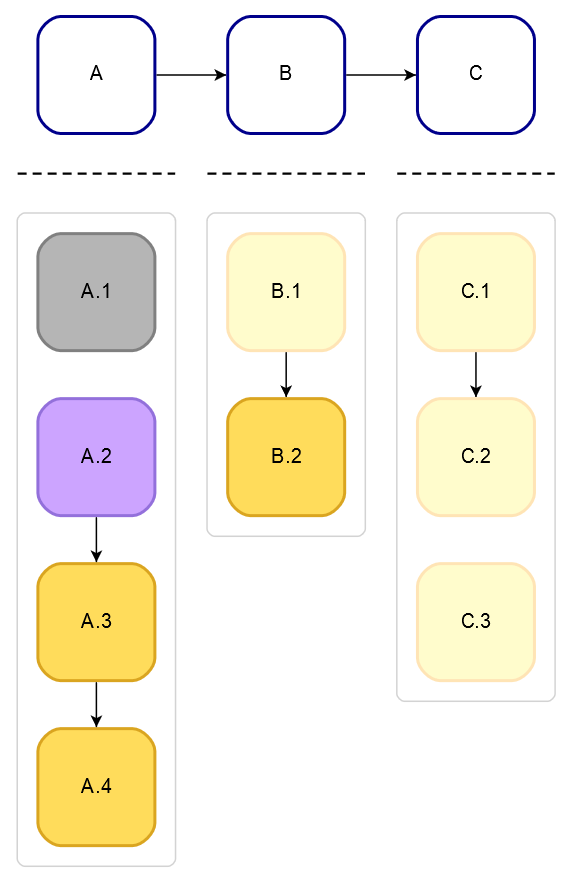
Nice! Looks great.
I could use a bounding box for the top row instead of a line. I’m guessing to do that I would retain references to the ‘A’, ‘B’ panels and directly add a group object via diagram API.
  function init() {
    var $ = go.GraphObject.make;

    myDiagram =
      $(go.Diagram, "myDiagramDiv",
        {
          initialContentAlignment: go.Spot.Center,  // for v1.*
          layout: $(go.TreeLayout, { layerSpacing: 20, alignment: go.TreeLayout.AlignmentStart }),
          "DocumentBoundsChanged": function(e) {
            header.elt(0).width = e.diagram.documentBounds.width-10;
          }
        });

    var header =
      $(go.Part,
        { position: new go.Point(0, -10), layerName: "Grid" },
        $(go.Shape, { fill: null })
      );

    myDiagram.add(header);

    myDiagram.nodeTemplate =
      $(go.Node, "Auto",
        { width: 80, height: 80 },
        $(go.Shape, "RoundedRectangle",
          { parameter1: 15, fill: "white", strokeWidth: 2, portId: "" },
          new go.Binding("stroke", "color"),
          new go.Binding("fill", "color", go.Brush.lighten)),
        $(go.TextBlock, { editable: true },
          new go.Binding("text"))
      );

    myDiagram.groupTemplate =
      $(go.Group, "Vertical",
        { layout: $(go.GridLayout, { wrappingColumn: 1, spacing: new go.Size(30, 30) }) },
        $(go.Panel, "Auto",
          { width: 80, height: 80, margin: new go.Margin(0, 0, 20, 0) },
          $(go.Shape, "RoundedRectangle",
            { parameter1: 15, fill: "white", strokeWidth: 2, portId: "" },
            new go.Binding("stroke", "color")),
          $(go.TextBlock,
            new go.Binding("text"))
        ),
        $(go.Panel, "Auto",
          $(go.Shape, "RoundedRectangle",
            { fill: null, stroke: "lightgray" }),
          $(go.Placeholder,
            { padding: 10 })
        )
      );

    myDiagram.model = new go.GraphLinksModel(
      [
        { key: 100, text: "A", isGroup: true, color: "darkblue" },
        { key: 200, text: "B", isGroup: true, color: "darkblue" },
        { key: 300, text: "C", isGroup: true, color: "darkblue" },
        { key: 101, text: "A.1", group: 100, color: "gray" },
        { key: 102, text: "A.2", group: 100, color: "mediumpurple" },
        { key: 103, text: "A.3", group: 100, color: "goldenrod" },
        { key: 104, text: "A.4", group: 100, color: "goldenrod" },
        { key: 201, text: "B.1", group: 200, color: "moccasin" },
        { key: 202, text: "B.2", group: 200, color: "goldenrod" },
        { key: 301, text: "C.1", group: 300, color: "moccasin" },
        { key: 302, text: "C.2", group: 300, color: "moccasin" },
        { key: 303, text: "C.3", group: 300, color: "moccasin" }
      ],
      [
        { from: 100, to: 200 },
        { from: 200, to: 300 },
        { from: 102, to: 103 },
        { from: 103, to: 104 },
        { from: 201, to: 202 },
        { from: 301, to: 302 }
      ]);
  }
So this uses a separate Part, remembered in header, that is in the “Grid” Layer so that it isn’t selectable and isn’t laid out by the Diagram.layout. Each time the Diagram.documentBounds changes, a listener changes the width of the header’s shape.
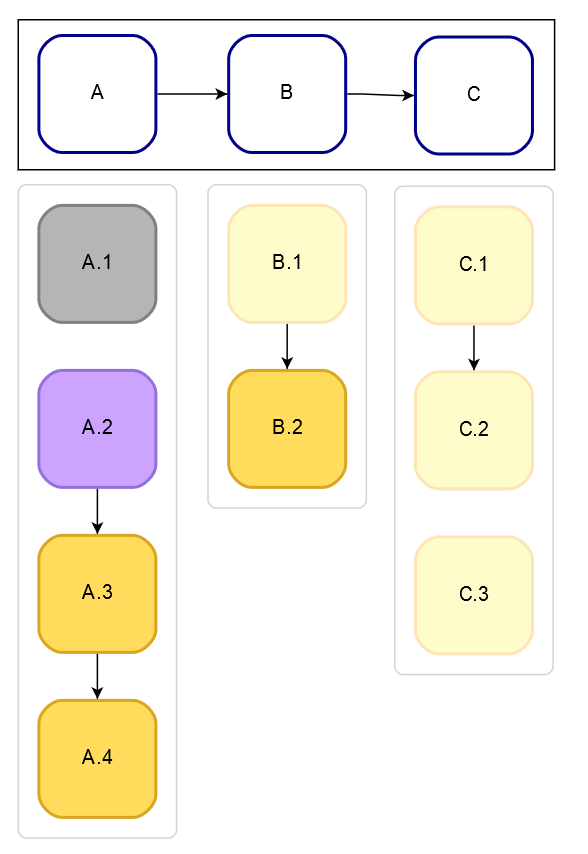
Thanks for the help. This will work well.
I have experimented with Graphviz, Mermaid, d3, colajs, Cytoscape, jointjs, dagre for various diagramming work. GoJS provides building blocks that makes implementation simple, but without sacrificing flexibility.
Much more affordable than yFiles from what I can tell.
Thanks. If there are any specific features that you think we should have, please tell us.