Hi Team,
in the last topic I faced some problems related to deleting some rows but now it seems to be solved… I have two questions now:
-
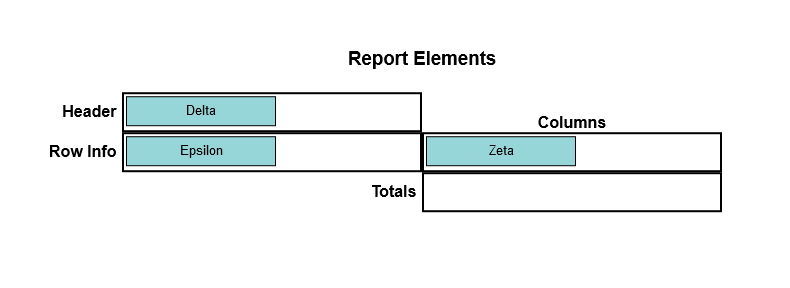
- why the borders are colored only after starting drag?
-
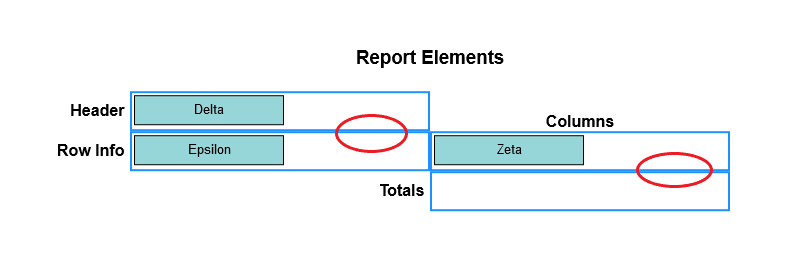
- is possible to insert some spacing (2 pix) among cells’ borders? In the 2nd picture above borders seems to be bold but it depends on the borders very near (circled with red in)
after drag (with “bold” cell borders)
- is possible to insert some spacing (2 pix) among cells’ borders? In the 2nd picture above borders seems to be bold but it depends on the borders very near (circled with red in)
Here my code:
      myDiagram =
          $(go.Diagram, "myDiagramRep",
            {
              layout: $(TableLayout, { isRealtime: false },
                $(go.RowColumnDefinition, { row: 1, height: 22 }),  // fixed size column headers
                $(go.RowColumnDefinition, { column: 1, width: 22 }) // fixed size row headers
              ),
              // feedback that dropping in the background is not allowed
              mouseDragOver: function(e) { e.diagram.currentCursor = "not-allowed"; },
              // when dropped in the background, not on a Node or a Group, cancel the drop
              mouseDrop: function(e) { e.diagram.currentTool.doCancel(); },
              "animationManager.isInitial": false,
              "undoManager.isEnabled": true
            });

      function cellBindings() {
          return [
            new go.Binding("row").makeTwoWay(),
            new go.Binding("rowSpan"),
            new go.Binding("column", "col").makeTwoWay(),
            new go.Binding("columnSpan", "colSpan"),
            new go.Binding("alignment", "align", go.Spot.parse)
          ];
        }

        myDiagram.nodeTemplateMap.add("Header",  // an overall table header, at the top
          $(go.Part, "Auto", cellBindings(),
            {
              row: 0, column: 3, columnSpan: 9999,
              stretch: go.GraphObject.Horizontal,
              selectable: false, pickable: false
            },
            $(go.Shape, { fill: "transparent", strokeWidth: 0 }),
            $(go.TextBlock, { alignment: go.Spot.Bottom, font: "bold 14pt sans-serif" },
              new go.Binding("text"))
          ));

        myDiagram.nodeTemplateMap.add("Sider",  // an overall table header, on the left side
          $(go.Part, "Auto", cellBindings(),
            {
              row: 1, rowSpan: 9999, column: 0,
              stretch: go.GraphObject.Vertical,
              selectable: false, pickable: false
            },
            $(go.Shape, { fill: "transparent", strokeWidth: 0 }),
            $(go.TextBlock, { alignment: go.Spot.Right, font: "bold 14pt sans-serif", angle: 270 },
              new go.Binding("text"))
          ));

        myDiagram.nodeTemplateMap.add("Column Header",  // for each column header
          $(go.Part, "Auto", cellBindings(),
            {
              row: 1,
              layerName: "Background",
              stretch: go.GraphObject.Horizontal,
              alignment: go.Spot.Bottom,
              background: "transparent",
              selectable: false
            },
            $(go.TextBlock,
              {
                font: "bold 12pt sans-serif", textAlign: "center", isMultiline: false,
                wrap: go.TextBlock.None, overflow: go.TextBlock.OverflowEllipsis
              },
              new go.Binding("text"))
          ));

        myDiagram.nodeTemplateMap.add("Row Sider",  // for each row header
          $(go.Part, "Auto", cellBindings(),
            {
              column: 1,
              layerName: "Background",
              stretch: go.GraphObject.Vertical,
              alignment: go.Spot.Right,
              background: "transparent",
              selectable: true
              },
            $(go.Shape, { fill: null, stroke: null },
              new go.Binding("fill", "color")),
            $(go.TextBlock,
              {
            	margin: new go.Margin(0,5),
                font: "bold 12pt sans-serif", textAlign: "center", angle: 0,
                isMultiline: false, wrap: go.TextBlock.None, overflow: go.TextBlock.OverflowEllipsis
              },
              new go.Binding("text"))
          ));

        myDiagram.nodeTemplate =  // for regular nodes within cells (groups); you'll want to extend this
          $(go.Node, "Auto", cellBindings(),
            { width: 150, height: 30, margin: 4 },  // assume uniform Margin, all around
            $(go.Shape, { fill: "white" },
              new go.Binding("fill", "color")),
            $(go.TextBlock,
              new go.Binding("text"))
          );

        myDiagram.groupTemplate =  // for cells
          $(go.Group, "Auto", cellBindings(),
            {
              layerName: "Background",
              stretch: go.GraphObject.Fill,
              minSize: new go.Size(300, 40),
              selectable: false,
              layout: $(go.GridLayout, { wrappingColumn: 1 }),
              computesBoundsAfterDrag: true,
              computesBoundsIncludingLocation: true,
              handlesDragDropForMembers: true,  // don't need to define handlers on member Nodes and Links
              mouseDragEnter: function(e, group, prev) { group.isHighlighted = true; },
              mouseDragLeave: function(e, group, next) { group.isHighlighted = false; },
              mouseDrop: function(e, group) {
                // if any dropped part wasn't already a member of this group, we'll want to let the group's row
                // column allow themselves to be resized automatically, in case the row height or column width
                // had been set manually by the LaneResizingTool
                var anynew = e.diagram.selection.any(function(p) { return p.containingGroup !== group; });
                // Don't allow headers/siders to be dropped
                var anyHeadersSiders = e.diagram.selection.any(function(p) {
                  return p.category === "Column Header" || p.category === "Row Sider";
                });

                if(group.memberParts.count==1){ //only one node can be dropped
                	e.diagram.currentTool.doCancel();
                	return;
                }
                if (group.key=="4-3") { //totals can be dropped
                	e.diagram.currentTool.doCancel();
                	return;
                }
                if (!anyHeadersSiders && group.addMembers(e.diagram.selection, true)) {
                  if (anynew) {
                    e.diagram.layout.getRowDefinition(group.row).height = NaN;
                    e.diagram.layout.getColumnDefinition(group.column).width = NaN;
                  }
                  e.diagram.layout.invalidateLayout();
                } else {  // failure upon trying to add parts to this group
                  e.diagram.currentTool.doCancel();
                }

              }
            },
            new go.Binding("row"),
            new go.Binding("column", "col"),
            // the group is normally unseen -- it is completely transparent except when given a color or when highlighted
            $(go.Shape,
              {
                fill: "transparent",
                strokeWidth: 2,
                stroke: "dodgeblue",
                stretch: go.GraphObject.Fill
              },
              new go.Binding("fill", "color"),
              new go.Binding("fill", "isHighlighted",
                             function(h, shape) { return h ? "lightblue" : shape.part.data.color; }).ofObject()),
            $(go.Placeholder,
              { // leave a margin around the member nodes of the group which is the same as the member node margin
                alignment: (function(m) { return new go.Spot(0, 0, m.top, m.left); })(myDiagram.nodeTemplate.margin),
                padding: (function(m) { return new go.Margin(0, m.right, m.bottom, 0); })(myDiagram.nodeTemplate.margin)
              })
          );
[...]
	      myDiagram.model = new go.GraphLinksModel([
	          // headers
	          { text: "Report Elements", category: "Header", col: 2, colSpan: 2 },
	          // column and row headers
	          { text: "", col: 2, category: "Column Header", row: 1 },
	          { key: "Columns1", text: "Columns", col: 3, category: "Column Header", row: 2 },
	          { key: "Header1", text: "Header", row: 2, category: "Row Sider" },
	          { key: "Info", text: "Row Info", row: 3, category: "Row Sider" },
	          { key: "Totals", text: "Totals", row: 4, category: "Row Sider", col: 2 },
	          // cells, each a group assigned to a row and column
	          { key: "2-2", row: 2, col: 2, isGroup: true, color: "white" },
	          { key: "3-2", row: 3, col: 2, isGroup: true, color: "white" },
	          { key: "3-3", row: 3, col: 3, isGroup: true, color: "white" },
	          //{ key: "4-2", row: 4, col: 2, isGroup: true, color: "lightyellow" },
	          { key: "4-3", row: 4, col: 3, isGroup: true, color: "white" },
	          // nodes, each assigned to a group/cell
	          { text: "Delta", color: "#96D6D9", size: "100 100", group: "2-2" },
	          { text: "Epsilon", color: "#96D6D9", size: "100 50", group: "3-2" },
	          { text: "Zeta", color: "#96D6D9", size: "50 70", group: "3-3" },
	          //{ text: "Theta", color: "tomato", size: "100 50", group: "4-3" }
	        ]);

Thx
F