I have been racking my brain over this problem and hope somebody can shed some light. (we are still in the evaluation stage, but close to final decision). I cannot seem to find anything in the samples or documentation to explain this behavior.
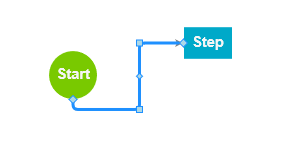
Here is what I am wanting it to do. Drag two objects with ports from the palette to the diagram layout. Create a link from the bottom of “Start” to the top of “Step”.
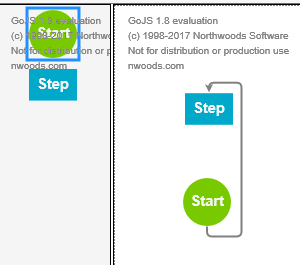
This works fine as long as the data looks like this
{ “class”: “go.GraphLinksModel”,
“linkFromPortIdProperty”: “fubar1”,
“linkToPortIdProperty”: “fubar2”,
“nodeDataArray”: [
],
“linkDataArray”: [
]}
`
Note the naming convention of “linkFromPortIdProperty” and “linkToPortIdProperty”. I can use any string value I want and it does not have to correlate to anything in the code.
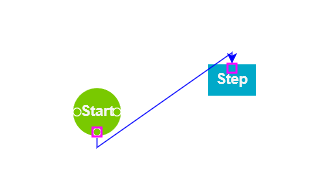
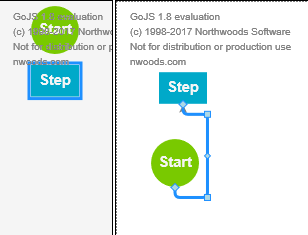
Now, change that data by removing even one of those properties or even just setting one with an empty string:
{ "class": "go.GraphLinksModel", "linkFromPortIdProperty": "fubar1", "linkToPortIdProperty": "", "nodeDataArray": [ ], "linkDataArray": [ ]}
…and perform the very same steps of dragging and linking above, this happens with the link not ending at the top of “Step”, but snaps to the bottom of it.
Here is the javascript which I took from Flowchart with very slight modification:
var myDiagram;
var $GO = go.GraphObject.make; // for conciseness in defining templates
$(document).ready(function() {
myDiagram =
$GO(go.Diagram, “myDiagramDiv”,
{
initialContentAlignment: new go.Spot(0, 0, 0, -50),
allowDrop: true, // must be true to accept drops from the Palette
//“linkingTool.archetypeLinkData”: { category: “paletteIconLinks” }, //this is necessary for palette icons to use a different link group (arrows) when dragged from palette into main diagram
scrollsPageOnFocus: false,
“undoManager.isEnabled”: true
}
);var lightText = 'whitesmoke'; myDiagram.nodeTemplateMap.add("", // the default category $GO(go.Node, "Spot", nodeStyle(), // the main object is a Panel that surrounds a TextBlock with a rectangular Shape $GO(go.Panel, "Auto", $GO(go.Shape, "Rectangle", { fill: "#00A9C9", stroke: null }, new go.Binding("figure", "figure")), $GO(go.TextBlock, { font: "bold 11pt Helvetica, Arial, sans-serif", stroke: lightText, margin: 8, maxSize: new go.Size(160, NaN), wrap: go.TextBlock.WrapFit, editable: true }, new go.Binding("text").makeTwoWay()) ), // four named ports, one on each side: makePort("T", go.Spot.Top, false, true), makePort("L", go.Spot.Left, true, true), makePort("R", go.Spot.Right, true, true), makePort("B", go.Spot.Bottom, true, false) )); myDiagram.nodeTemplateMap.add("Start", $GO(go.Node, "Spot", nodeStyle(), $GO(go.Panel, "Auto", $GO(go.Shape, "Circle", { minSize: new go.Size(40, 40), fill: "#79C900", stroke: null }), $GO(go.TextBlock, "Start", { font: "bold 11pt Helvetica, Arial, sans-serif", stroke: lightText }, new go.Binding("text")) ), // three named ports, one on each side except the top, all output only: makePort("L", go.Spot.Left, true, false), makePort("R", go.Spot.Right, true, false), makePort("B", go.Spot.Bottom, true, false) )); myDiagram.linkTemplate = $GO(go.Link, // the whole link panel { routing: go.Link.AvoidsNodes, curve: go.Link.JumpOver, corner: 5, toShortLength: 4, relinkableFrom: true, relinkableTo: true, reshapable: true, resegmentable: true, // mouse-overs subtly highlight links: mouseEnter: function(e, link) { link.findObject("HIGHLIGHT").stroke = "rgba(30,144,255,0.2)"; }, mouseLeave: function(e, link) { link.findObject("HIGHLIGHT").stroke = "transparent"; } }, $GO(go.Shape, // the highlight shape, normally transparent {isPanelMain: true, strokeWidth: 8, stroke: "transparent", name: "HIGHLIGHT" } ), $GO(go.Shape, // the link path shape {isPanelMain: true, stroke: "gray", strokeWidth: 2 } ), $GO(go.Shape, // the arrowhead {toArrow: "standard", stroke: null, fill: "gray"} ), $GO(go.Panel, "Auto", // the link label, normally not visible {visible: false, name: "LABEL", segmentIndex: 2, segmentFraction: 0.5 }, new go.Binding("visible", "visible").makeTwoWay() ) );
//Execute to load
load();
// initialize the Palette that is on the left side of the page
myPalette =
$GO(go.Palette, “myPaletteDiv”, // must name or refer to the DIV HTML element
{
scrollsPageOnFocus: false,
nodeTemplateMap: myDiagram.nodeTemplateMap, // share the templates used by myDiagram
model: new go.GraphLinksModel([ // specify the contents of the Palette
{ category: “Start”, text: “Start” },
{ text: “Step” }
])
});function nodeStyle() { return [ // The Node.location comes from the "loc" property of the node data, // converted by the Point.parse static method. // If the Node.location is changed, it updates the "loc" property of the node data, // converting back using the Point.stringify static method. new go.Binding("location", "loc", go.Point.parse).makeTwoWay(go.Point.stringify), { // the Node.location is at the center of each node locationSpot: go.Spot.Center, //isShadowed: true, //shadowColor: "#888", // handle mouse enter/leave events to show/hide the ports mouseEnter: function (e, obj) { showPorts(obj.part, true); }, mouseLeave: function (e, obj) { showPorts(obj.part, false); } } ]; }
// Make all ports on a node visible when the mouse is over the node
function showPorts(node, show) {
  var diagram = node.diagram;
  if (!diagram || diagram.isReadOnly || !diagram.allowLink) return;
  node.ports.each(function(port) {
      port.stroke = (show ? "white" : null);
    });
}
  // Define a function for creating a "port" that is normally transparent.
  // The "name" is used as the GraphObject.portId, the "spot" is used to control how links connect
  // and where the port is positioned on the node, and the boolean "output" and "input" arguments
  // control whether the user can draw links from or to the port.
  function makePort(name, spot, output, input) {
    // the port is basically just a small circle that has a white stroke when it is made visible
    return $GO(go.Shape, "Circle",
             {
                fill: "transparent",
                stroke: null,  // this is changed to "white" in the showPorts function
                desiredSize: new go.Size(8, 8),
                alignment: spot, alignmentFocus: spot,  // align the port on the main Shape
                portId: name,  // declare this object to be a "port"
                fromSpot: spot, toSpot: spot,  // declare where links may connect at this port
                fromLinkable: output, toLinkable: input,  // declare whether the user may draw links to/from here
                cursor: "pointer"  // show a different cursor to indicate potential link point
             });
  }


//********* LOAD*****************//
  function load() {
    	myDiagram.model = go.Model.fromJson(document.getElementById("mySavedModel").value);
	}
});
And the HTML:
<div style="width: 100%; display: flex; justify-content: space-between">
 	<div id="myPaletteDiv" style="width: 115px; height:620px; margin-right: 2px; background-color: whitesmoke; border: solid 1px black"></div>
 	<div id="myDiagramDiv" style="flex-grow: 1; height: 620px; border: solid 1px black"></div>
</div>

<textarea id="mySavedModel" style="width:100%;height:300px">{ "class": "go.GraphLinksModel",
 "linkFromPortIdProperty": "fubar1",
  "linkToPortIdProperty": "",
  "nodeDataArray": [
 ],
  "linkDataArray": [
 ]}
  </textarea>