Hi,
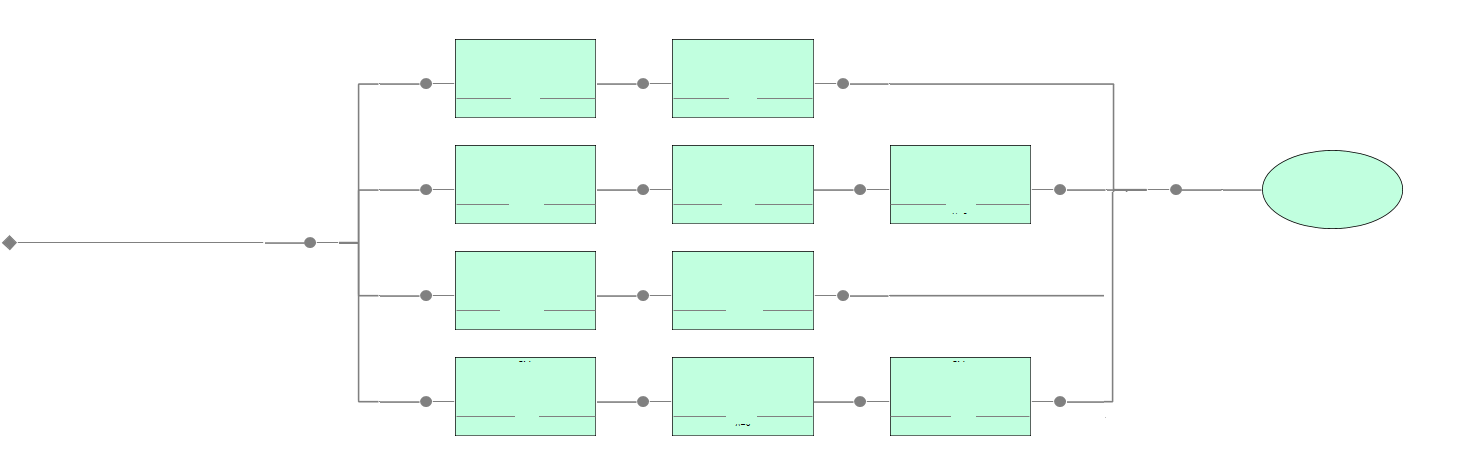
Please advice me what chart will fit best, among those in GoWpf Demo solution, to achieve following graph:
Currently I use TreeLayout but it seems to be difficult to customize.
Hi,
Please advice me what chart will fit best, among those in GoWpf Demo solution, to achieve following graph:
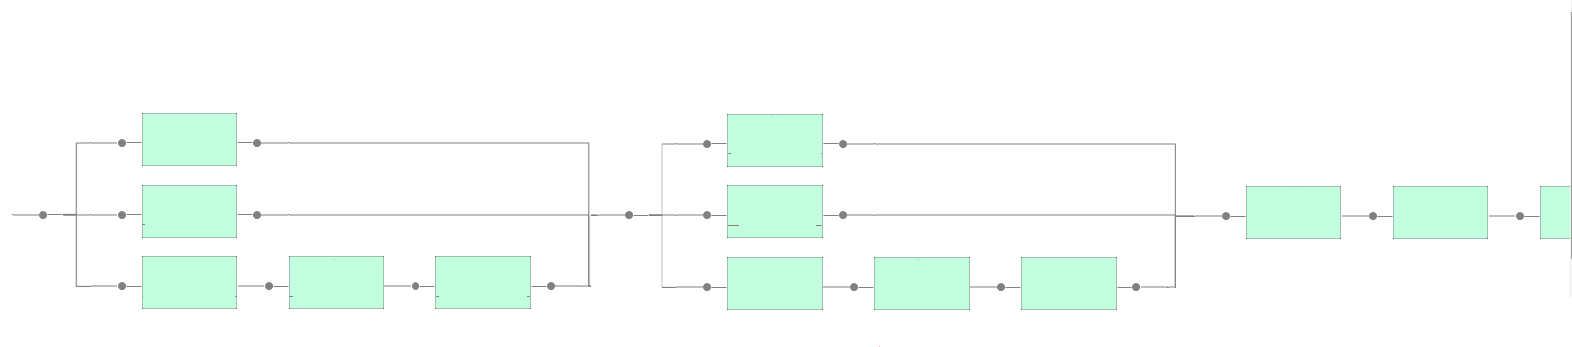
If there were two Groups in your screenshot, each containing nearly half the nodes and links, on the left and on the right side of your screenshot, then you could assign Group.Layout to be an instance of:
  // This assumes the tree only grows horizontally: Angle == 0 or 180
  public class CustomTreeLayout : TreeLayout {

    // If links are orthogonal, modify their middle points so that the vertical segments
    // in each layer are all co-linear.
    protected override void LayoutLinks() {
      foreach (TreeVertex v in this.Network.Vertexes) {
        if (v.SourceEdgesCount > 1) {
          double x = v.Bounds.X - 25;  //??? hard-coded 25
          foreach (TreeEdge e in v.SourceEdges) {
            Link link = e.Link;
            if (link == null) continue;
            Route route = link.Route;
            if (route.Routing == LinkRouting.Normal) continue;
            // require orthogonal links
            Point p2 = route.GetPoint(2);
            Point p3 = route.GetPoint(3);
            p2.X = x - 25;
            p3.X = x - 25;
            route.SetPoint(2, p2);
            route.SetPoint(3, p3);
          }
        }
      }
      base.LayoutLinks();
    }
}
If you are not using Groups to hold subgraphs including both the “split” node and the “merge” node, then implementing a suitable layout will get much more complicated.
Here are 3 examples of graphs that I want to visualize:
1:
Using the custom TreeLayout is fine, in my experience. The problem is in dividing up the graph into Groups.
Note that the Groups can be completely transparent, with basically a minimal visual tree, so the appearance of the graph can continue to be exactly like what you show.