Synchronization of Node Collapse/Expand in two diagrams

@walter, While working with the following sample which you provided: Basic Day/Hour Infinite Timeline

I tried to add “sub row headers” on the left side diagram and corresponding nodes in the main diagram.

But, how it is possible to control the “Collapsing/Expandingrows on both the diagrams using a “button” (+/-) only in the “row header” diagram (left diagram) for each row as shown in the following diagrams:

All Rows Collapsed:


Row 4 Expanded:

Also, how can i create such a tree like structure for each row in left side diagram?

The requirement is to show, for example, “row 4.1”, “row 4.2” and “row 4.3” in left side diagram, and corresponding nodes in right side diagram, When [+] button is clicked on “row 4”. That** is, “row 4” is expanded.
And, when clicked on [-] button, “row 4.1”, “row 4.2” and “row 4.3” will be collapsed with the corresponding rows in right side diagram.

Thanks.

GoJS Tree View shows you how to create the tree in the row headers diagram. Look carefully at how it is implemented so that you can customize its appearance.

Then in a “TreeCollapsed” DiagramEvent listener you can find out which nodes were collapsed – which means the number of rows if you call Node | GoJS API and count the nodes in the subtree: (n.findTreeParts().count-1)/2.

Assuming you know which row the collapsed node is in, you know which rows of nodes to make invisible in the main diagram. All nodes in rows greater than that row can be moved up.

Do the opposite work in a “TreeExpanded” listener.

Yes, i do have this segregation, which nodes can undergo Visible/Invisible (Collapse/Expand).

Nodes in “Green” will always be visible, Others, which are in sub rows, will toggle (Visible/Invisible).

Hi @walter, i have couple of more queries on the multi-div timeline sample Basic Day/Hour Infinite Timeline

Following is the current view:

Here,

1. “row header” diagram’s horizontal gridlines are not matching “main” diagram’s horizontal gridlines. How this can be corrected?

2. Disable vertical scrolling (scroll up-down), allow vertical scrolling (scroll left-right) only. How this can be done?

Restricted the node movement to left-right only by using following:

  minLocation: new go.Point(-Infinity, NaN) 
  maxLocation: new go.Point(Infinity, NaN)

The Basic Day/Hour Infinite Timeline sample has “ViewportBoundsChanged” listeners to synchronize the value of Diagram.position and Diagram.scale. Perhaps you have added functionality that breaks that synchronization?

By the way, adding minLocation or maxLocation constrains node movement, not scrolling. That is an important terminology distinction to make, because moving a node is quite different from scrolling a diagram. The former changes the value of a node’s Node.location; the latter changes Diagram.position which shifts all nodes.

Yeah, That’s my bad… it is node movement that i wanted to restrict vertically (up-down).

I just added a shape to shown borders around each row in “rowheaders” diagram and adjusted the width as well using the following code lines after which there is mismatch in the gridlines:

myRowHeaders =
    $(go.Diagram, "myRowHeadersDiv",
      {
    	isReadOnly: true,
        "animationManager.isEnabled": false,
        allowHorizontalScroll: false,
        contentAlignment: go.Spot.TopCenter,
        padding: 0,
        "ViewportBoundsChanged": function(e) {
          myDiagram.scale = e.diagram.scale;
          myDiagram.position = new go.Point(myDiagram.viewportBounds.x, e.diagram.position.y);
        },
        nodeTemplate:
          $(go.Part,  "Auto", // don't need any links
        	{ width: 189, height: gridHeight, selectionAdorned: false },	  
            new go.Binding("position", "row", function(row) { return new go.Point(-10, convertRowToY(row)-5); }),
            $(go.Shape, "Rectangle",
              { stroke: "black", strokeWidth: 1, portId: "", fromLinkable: false, toLinkable: false , fill : null}),
            $(go.TextBlock,
              { width: "100%", alignment: go.Spot.Center, verticalAlignment: go.Spot.Left },
              new go.Binding("text"))
          )
      });

Hi @walter,

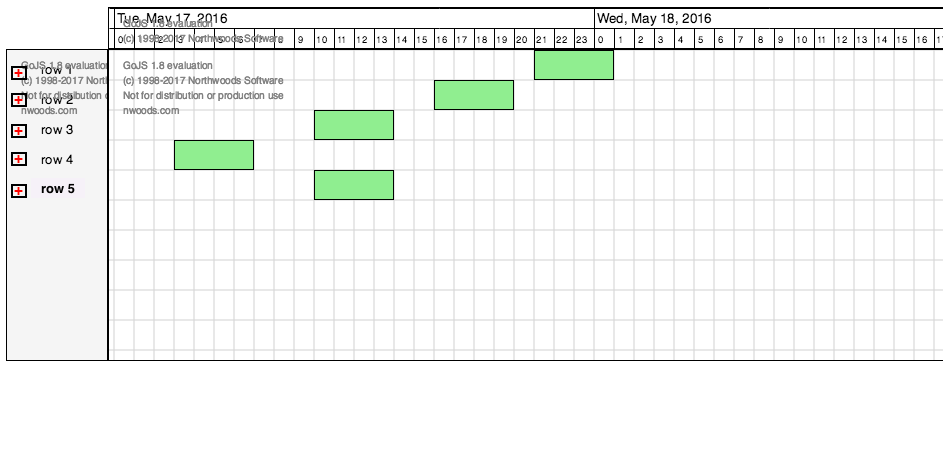
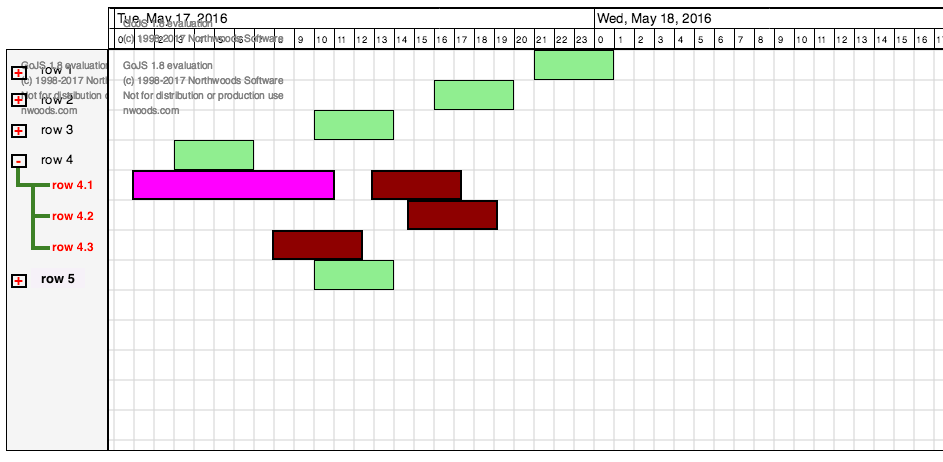
I am trying to use a different approach to provide “Tree Like” view, where i am not using “TreeExpanderButton”. Instead, i added all the nodes, that need to be in the sub-tree, in the same “rows” model for “rowheaders” diagram and corresponding nodes in the main diagram on right hand side.

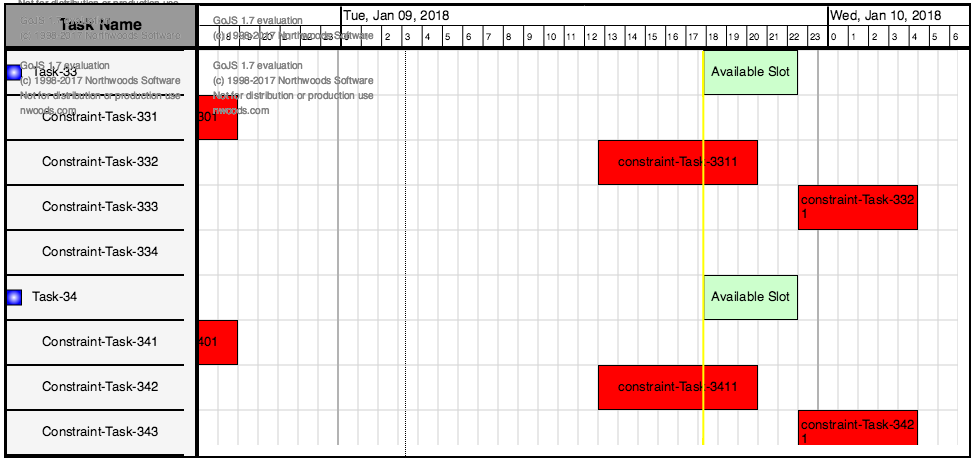
Also, i have used a “square” shape which i want to use as a button (Blue colored on left of “Task-33” and “Task-34” in “rowheaders” diagram).

Now, am trying to add a functionality to this button, where, if i click on this button, it will toggle the “visibility” of “sub-tree” nodes (nodes without blue square shape box on left with name “Constaint-Task-331”, “Constaint-Task-332”, “Constaint-Task-333”, etc).

Also, clicking on this button will toggle the “visibility” of corresponding “Red” colored nodes in the main diagram on the right hand side.

Currently, i am not able to toggle the visibility of nodes on either sides.

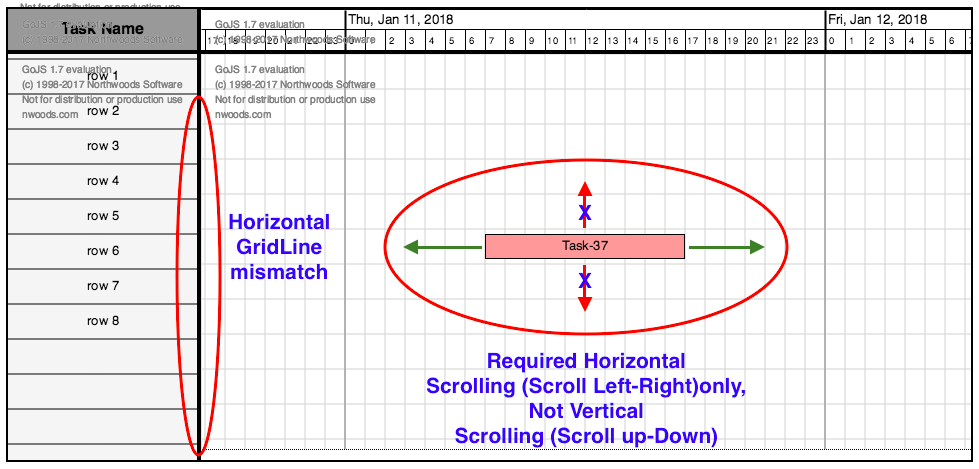
Also, when nodes are invisible/hidden, “Nodes” after them need to move up as well.

Could you please help me in this?

Thanks.

PS:

  myRowHeaders =
    $(go.Diagram, "myRowHeadersDiv",
      {
    	isReadOnly: true,
        "animationManager.isEnabled": false,
        allowHorizontalScroll: false,
        contentAlignment: go.Spot.TopCenter,
        padding: 0,
        "ViewportBoundsChanged": function(e) {
          myDiagram.scale = e.diagram.scale;
          myDiagram.position = new go.Point(myDiagram.viewportBounds.x, e.diagram.position.y);
        },
        nodeTemplate:
          $(go.Part,  "Auto", // don't need any links
        	{ width: 180, height: gridHeight, selectionAdorned: false },	  
            new go.Binding("position", "row", function(row) { return new go.Point(0, convertRowToY(row)); }),
            $(go.Shape, "Rectangle",
    		   { stroke: "black", strokeWidth: 1, portId: "", fromLinkable: false, toLinkable: false , fill : null}),
    		$(go.Panel, "Horizontal",
    			{ alignment: go.Spot.Left},
    				//Blue color shape to be used as button
    				$(go.Shape, "Square",
						{
							strokeWidth: 1,
							name: "ECR",
							desiredSize: new go.Size(15, 15),
							fill: "white",
							click: function (e, shape) {
								var diagram = e.diagram;
								// Toggling shape color
								if (isTreeExpanded == true) {
									isTreeExpanded = false;
									shape.fill = "white";
								}
								else {
									isTreeExpanded = true;
									shape.fill = $(go.Brush, "Radial", { 0: "white", 1: "blue" });
								}	
							}				  	    				
						},
					       // Remove shape from "sub-tree" nodes
				                new go.Binding("opacity", "",function(data) { 
			                	    if (data.istask == true) {return 1;}
			                	    else  {return 0;} 
			                })),
					$(go.TextBlock,
					  { width: "100%", margin: 10, alignment: go.Spot.Center, verticalAlignment: go.Spot.Left },
					  new go.Binding("text"))
	          )
          )
      });

For all of the nodes that you want to change visiblity, set their visible property to true or false as desired.

For all of the nodes that you want to remain visible, move them up by the appropriate distance by setting their position to a new Point with the same .position.x value but with a different .position.y value.

I tried to use “visible” property, but it not making any impact.

I have used it as follows:

  myRowHeaders =
    $(go.Diagram, "myRowHeadersDiv",
      {
    	...
        nodeTemplate:
          $(go.Part,  "Auto", // don't need any links
        	{ width: 180, height: gridHeight, selectionAdorned: false },	  
            new go.Binding("position", "row", function(row) { return new go.Point(0, convertRowToY(row)); }),
            $(go.Shape, "Rectangle",
    		   { stroke: "black", strokeWidth: 1, portId: "", fromLinkable: false, toLinkable: false , fill : null}),
    		$(go.Panel, "Horizontal",
    			...
	          ),
              
              new go.Binding("visible", "isCS",function(isCS) { 
                	// Toggle visibility of "Constraint" nodes only
                	if ((isCS == true) && (isTreeExpanded == true)) {
                		return true;
                	}
                	else if ((isCS == true) && (isTreeExpanded == false)) {
                		return false;
                	}
                	else {
                		return true;
                	}
                })
          )
      });

Oh, I guess I wasn’t clear. I was suggesting that you set Node.visible and Node.position, not any data property. I had been assuming that state would not be in the model.

Although if you really want to have that state in the model, you could use data bindings. Remember to call Model.setDataProperty.

I am updating the value of “isTreeExpanded” variable on button click, but, in the binding function for “visible”, it is not taking the updated value of “isTreeExpanded”. It is always the “true”, the initial value.

If you don’t have a tree structured graph, don’t use a “TreeExpanderButton”. Just use a “Button” and implement its click event handler to do what you want.

Yeah, i am not using TreeExpanderButton as mentioned above, “isTreeExpanded” is just a variable which i have used in my program.

Hi @walter,

I have tried with the following:

click: function (e, shape) {
	var diagram = e.diagram;
	
	var nodeRowHeaders = myRowHeaders.findNodeForKey(shape.part.data.key);
	var modelRowDiagram = myRowHeaders.model;
	
	var nodeDiagram = myDiagram.findNodeForKey(shape.part.data.key);
	var modelDiagram = myDiagram.model;
	
	modelRowHeaders.startTransaction("change visibility");

	if (shape.part.data.isCS == true) {
		modelRowDiagram.setDataProperty(nodeRowHeaders.data, "visible", isTreeExpanded);
	}

	modelRowHeaders.commitTransaction("change visibility");
	
	
	modelDiagram.startTransaction("change visibility");

	if (node.data.isCS == true) {
		modelDiagram.setDataProperty(nodeDiagram.data, "visible", isTreeExpanded);
	}

	modelDiagram.commitTransaction("change visibility");		
}  

But, here, in the following lines:

   var nodeRowHeaders = myRowHeaders.findNodeForKey(shape.part.data.key);

It is giving “null”, but it shouldn’t be, because there is node with that key value.

But, my requirement is to process the “visible” property of all those nodes for which the current node is the parent node.

How can this be done?

Thanks.

shape.part should be that Node, so you don’t need to search for it using its key. I can’t explain why findNodeForKey returned null.

Hi @walter,

Coming back to sync problem of two diagrams (the way done in this sample: Basic Day/Hour Infinite Timeline) :

“myColumnHeaders” diagram goes out of sync with “myDiagram” when the number of rows goes out of the view.

When all the rows are in view, sync is fine:

When all the rows are in “NOT” view, diagrams goes OUT of sync:

Could you please suggest, what is the issue here, and, how can these diagrams remain sync, even when all the rows are not in view.

Thanks.

There should be three “ViewportBoundsChanged” DiagramEvent listeners.

The one for myColumnHeaders should just be setting the X value for a new myDiagram.position. Although I think in Basic Day/Hour Infinite Timeline there’s no need for this listener because the user can’t pan or zoom in that diagram.

The one for myRowHeaders should just be setting the Y value for a new myDiagram.position.

The one for myDiagram should be setting the X value for a new myColumnHeaders.position and setting the Y value for a new myRowHeaders.position.

In Basic Day/Hour Infinite Timeline there’s only a “DocumentBoundsChanged” listener just to make sure that the row headers are at least as tall as the document shown in myDiagram. If you are changing the size of the document in myRowHeaders, then you cannot use the “DocumentBoundsChanged” listener used in the sample, because it is setting the Diagram.fixedBounds of myRowHeaders. Basically you’ll want both diagrams to have documents that have a height equal to the greater of the two natural document bounds’ heights. I’m not sure what you want to do.

I am not changing size of the document in myRowHeaders manually, i am just keep on adding nodes in a row. As soon as the number of rows goes beyond the view limit, the diagrams goes out of sync.

Could you please suggest, how can i write “ViewportBoundsChanged” DiagramEvent listeners for the following:

1. The one for myColumnHeaders should just be setting the X value for a new myDiagram.position.
2. The one for myRowHeaders should just be setting the Y value for a new myDiagram.position.
3. The one for myDiagram should be setting the X value for a new myColumnHeaders.position and setting the Y value for a new myRowHeaders.position.

Basic Day/Hour Infinite Timeline already does two of them.