Table Layout - some cell border disappear/empty cell after title

Hi team,
I take the code from table layout example,
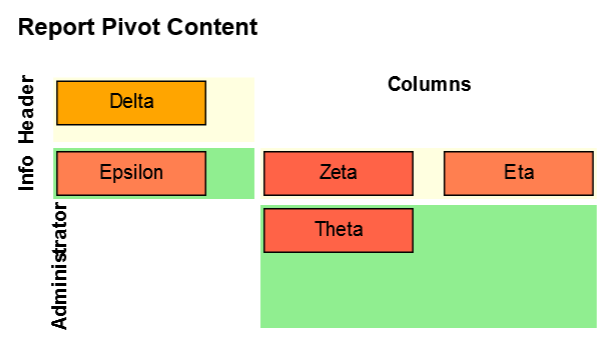
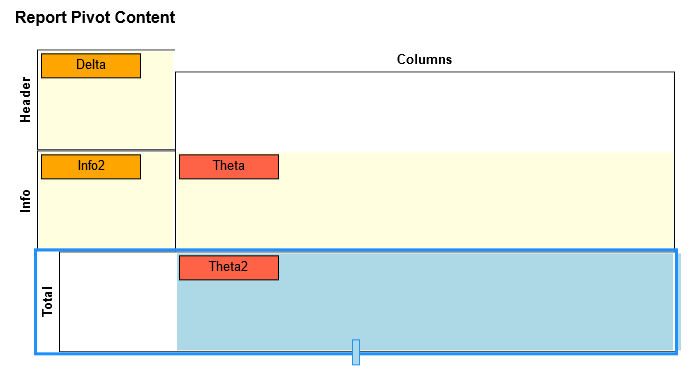
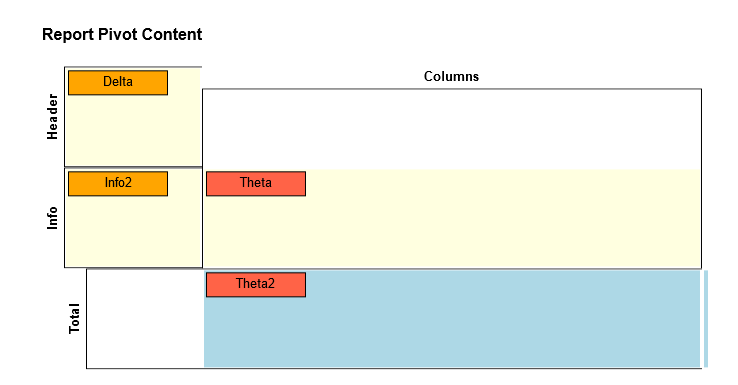
I’ve some problem in positioning cells within the column or row group, here’s my diagram


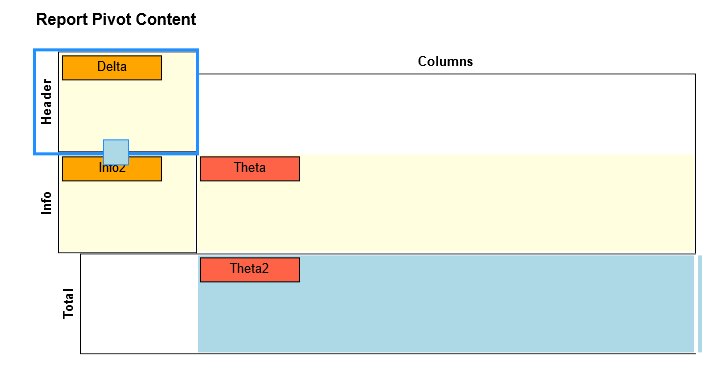
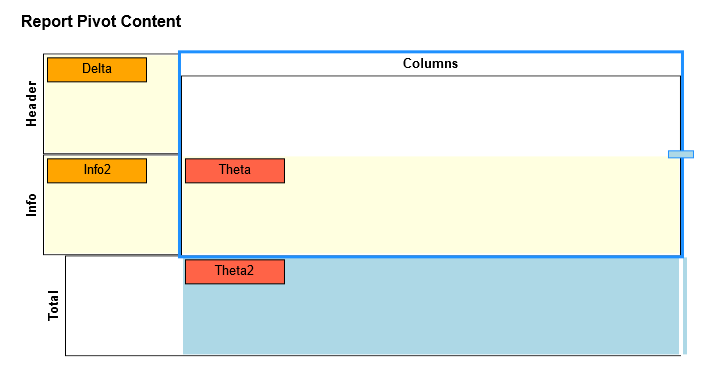
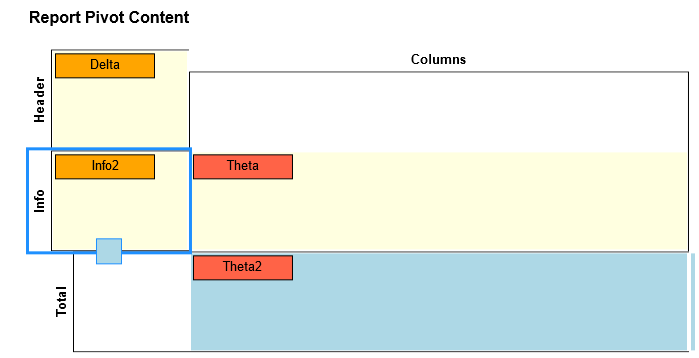
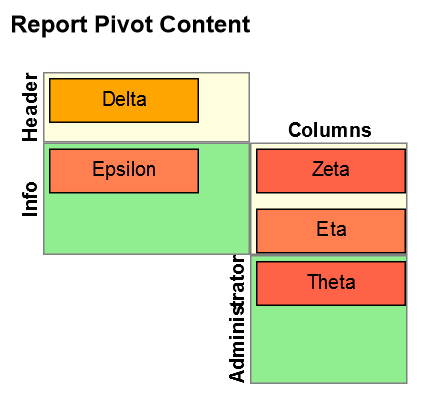
and here what I’m trying to achieve:
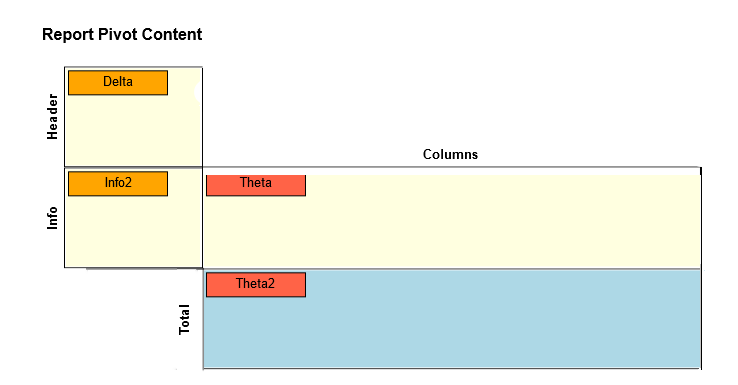
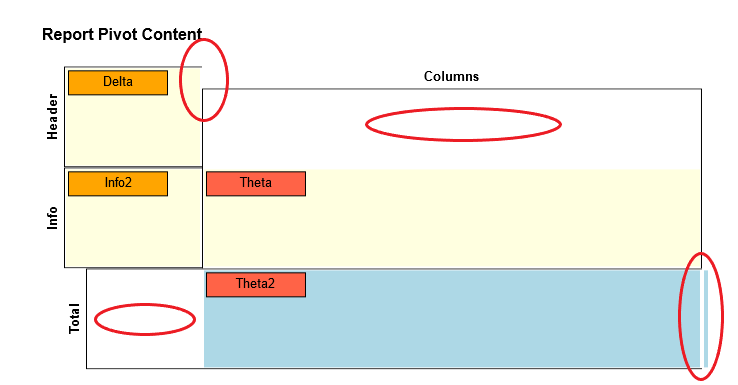
My questions are:

  1. why cells’ border are not filled when there’s no adjacent cell on the right? (probably I’ve forget some settings)
  2. why there’s an empty cell after column/row title in both cases?
    Here my code:
      myDiagram =
          $(go.Diagram, "myDiagramRep",
            {
              layout: $(TableLayout,
                $(go.RowColumnDefinition, { row: 1, height: 22 }),  // fixed size column headers
                $(go.RowColumnDefinition, { column: 1, width: 22 }) // fixed size row headers
              ),
              "InitialLayoutCompleted": function(e) {
                  // if not all Nodes have real locations, force a layout to happen
                  if (!e.diagram.nodes.all(function(n) { return n.location.isReal(); })) {
                    e.diagram.layoutDiagram(true);
              }},
          	  "SelectionMoved": function(e) { e.diagram.layoutDiagram(true); },
              "resizingTool": new LaneResizingTool(),
              // feedback that dropping in the background is not allowed
              mouseDragOver: function(e) { e.diagram.currentCursor = "not-allowed"; },
              // when dropped in the background, not on a Node or a Group, cancel the drop
              mouseDrop: function(e) { e.diagram.currentTool.doCancel(); },
              "animationManager.isInitial": false,
              "undoManager.isEnabled": true
            });

        myDiagram.nodeTemplateMap.add("Header",  // an overall table header, at the top
          $(go.Part, "Auto",
            {
              row: 0, column: 1, columnSpan: 2,
              stretch: go.GraphObject.Horizontal,
              selectable: false, pickable: false
            },
            $(go.Shape, { fill: "transparent", strokeWidth: 0 }),
            $(go.TextBlock, { alignment: go.Spot.Center, font: "bold 12pt sans-serif" },
              new go.Binding("text"))
          ));

        myDiagram.nodeTemplateMap.add("Sider",  // an overall table header, on the left side
          $(go.Part, "Auto",
            {
              row: 1, rowSpan: 2, column: 0,
              stretch: go.GraphObject.Vertical,
              selectable: false, pickable: false
            },
            $(go.Shape, { fill: "transparent", strokeWidth: 0 }),
            $(go.TextBlock, { alignment: go.Spot.Center, font: "bold 12pt sans-serif", angle: 270 },
              new go.Binding("text"))
          ));

        myDiagram.nodeTemplateMap.add("Column Header",  // for each column header
          $(go.Part, "Spot",
            {
              row: 2, rowSpan: 2, column: 2,
              minSize: new go.Size(500, NaN),
              stretch: go.GraphObject.Fill,
              movable: false,
              resizable: true,
              resizeAdornmentTemplate:
                $(go.Adornment, "Spot",
                  $(go.Placeholder),
                  $(go.Shape,  // for changing the length of a lane
                    {
                      alignment: go.Spot.Right,
                      desiredSize: new go.Size(25, 7),
                      fill: "lightblue", stroke: "dodgerblue",
                      cursor: "col-resize"
                    })
                )
            },
            new go.Binding("column", "col"),
            $(go.Shape, { fill: null },
              new go.Binding("fill", "color")),
            $(go.Panel, "Auto",
              { // this is positioned above the Shape, in row 1
                alignment: go.Spot.Top, alignmentFocus: go.Spot.Bottom,
                stretch: go.GraphObject.Horizontal,
                height: myDiagram.layout.getRowDefinition(1).height
              },
              $(go.Shape, { fill: "transparent", strokeWidth: 0 }),
              $(go.TextBlock,
                {
                  font: "bold 10pt sans-serif", isMultiline: false,
                  wrap: go.TextBlock.None, overflow: go.TextBlock.OverflowEllipsis
                },
                new go.Binding("text"))
            )
          ));

        myDiagram.nodeTemplateMap.add("Row Sider",  // for each row header with single cell
                $(go.Part, "Spot",
                  {
                    row: 2, column: 1, columnSpan: 2,
                    minSize: new go.Size(NaN, 100),
                    stretch: go.GraphObject.Fill,
                    movable: false,
                    resizable: true,
                    resizeAdornmentTemplate:
                      $(go.Adornment, "Spot",
                        $(go.Placeholder),
                        $(go.Shape,  // for changing the breadth of a lane
                          {
                            alignment: go.Spot.Bottom,
                            desiredSize: new go.Size(25, 25),
                            fill: "lightblue", stroke: "dodgerblue",
                            cursor: "row-resize"
                          })
                      )
                  },
                  new go.Binding("row"),
                  $(go.Shape, { fill: null },
                    new go.Binding("fill", "color")),
                  $(go.Panel, "Auto",
                    { // this is positioned to the left of the Shape, in column 1
                      alignment: go.Spot.Left, alignmentFocus: go.Spot.Right,
                      stretch: go.GraphObject.Vertical, angle: 270,
                      height: myDiagram.layout.getColumnDefinition(1).width
                    },
                    $(go.Shape, { fill: "transparent", strokeWidth: 0 }),
                    $(go.TextBlock,
                      {
                        font: "bold 10pt sans-serif", isMultiline: false,
                        wrap: go.TextBlock.None, overflow: go.TextBlock.OverflowEllipsis
                      },
                      new go.Binding("text"))
                  )
                ));

        myDiagram.nodeTemplateMap.add("Row Sider2",  // for each row header
                $(go.Part, "Spot",
                  {
                    row: 2, column: 2, columnSpan: 2,
                    minSize: new go.Size(NaN, 100),
                    stretch: go.GraphObject.Fill,
                    movable: false,
                    resizable: true,
                    resizeAdornmentTemplate:
                      $(go.Adornment, "Spot",
                        $(go.Placeholder),
                        $(go.Shape,  // for changing the breadth of a lane
                          {
                            alignment: go.Spot.Bottom,
                            desiredSize: new go.Size(7, 25),
                            fill: "lightblue", stroke: "dodgerblue",
                            cursor: "row-resize"
                          })
                      )
                  },
                  new go.Binding("row"),
                  $(go.Shape, { fill: null },
                    new go.Binding("fill", "color")),
                  $(go.Panel, "Auto",
                    { // this is positioned to the left of the Shape, in column 1
                      alignment: go.Spot.Left, alignmentFocus: go.Spot.Right,
                      stretch: go.GraphObject.Vertical, angle: 270,
                      height: myDiagram.layout.getColumnDefinition(1).width
                    },
                    $(go.Shape, { fill: "transparent", strokeWidth: 0 }),
                    $(go.TextBlock,
                      {
                        font: "bold 10pt sans-serif", isMultiline: false,
                        wrap: go.TextBlock.None, overflow: go.TextBlock.OverflowEllipsis
                      },
                      new go.Binding("text"))
                  )
                ));

        myDiagram.nodeTemplate =  // for regular nodes within cells (groups); you'll want to extend this
          $(go.Node, "Auto",
            { width: 100, height: 25, margin: 4 },  // assume uniform Margin, all around
            new go.Binding("row"),
            new go.Binding("column", "col"),
            $(go.Shape, { fill: "white" },
              new go.Binding("fill", "color")),
            $(go.TextBlock,
              new go.Binding("text", "key"))
          );

        myDiagram.groupTemplate =  // for cells
          $(go.Group, "Auto",
            {
              layerName: "Background",
              stretch: go.GraphObject.Fill,
              selectable: false,
              computesBoundsAfterDrag: true,
              computesBoundsIncludingLocation: true,
              handlesDragDropForMembers: true,  // don't need to define handlers on member Nodes and Links
              mouseDragEnter: function(e, group, prev) { group.isHighlighted = true; },
              mouseDragLeave: function(e, group, next) { group.isHighlighted = false; },
              mouseDrop: function(e, group) {
                // if any dropped part wasn't already a member of this group, we'll want to let the group's row
                // column allow themselves to be resized automatically, in case the row height or column width
                // had been set manually by the LaneResizingTool
                var anynew = e.diagram.selection.any(function(p) { return p.containingGroup !== group; });
                // Don't allow headers/siders to be dropped
                var anyHeadersSiders = e.diagram.selection.any(function(p) {
                  return p.category === "Column Header" || p.category === "Row Sider";
                });
                if (!anyHeadersSiders && group.addMembers(e.diagram.selection, true)) {
                  if (anynew) {
                    e.diagram.layout.getRowDefinition(group.row).height = NaN;
                    e.diagram.layout.getColumnDefinition(group.column).width = NaN;
                  }
                } else {  // failure upon trying to add parts to this group
                  e.diagram.currentTool.doCancel();
                }
              }
            },
            new go.Binding("row"),
            new go.Binding("column", "col"),
            // the group is normally unseen -- it is completely transparent except when given a color or when highlighted
            $(go.Shape,
              {
                fill: "transparent", stroke: "transparent",
                strokeWidth: myDiagram.nodeTemplate.margin.left,
                stretch: go.GraphObject.Fill
              },
              new go.Binding("fill", "color"),
              new go.Binding("stroke", "isHighlighted", function(h) { return h ? "red" : "transparent"; }).ofObject()),
            $(go.Placeholder,
              { // leave a margin around the member nodes of the group which is the same as the member node margin
                alignment: (function(m) { return new go.Spot(0, 0, m.top, m.left); })(myDiagram.nodeTemplate.margin),
                padding: (function(m) { return new go.Margin(0, m.right, m.bottom, 0); })(myDiagram.nodeTemplate.margin)
              })
          );
//[...]
        myDiagram.model = new go.GraphLinksModel([
            // headers
            { key: "Header", text: "Report Pivot Content", category: "Header" },
            // column and row headers
            { key: "Header", text: "Header", row: 2, category: "Row Sider" },
            { key: "Info", text: "Info", row: 3, category: "Row Sider" },
            { key: "Content", text: "Columns", col: 3, category: "Column Header" },
            { key: "Total", text: "Total", row: 4, category: "Row Sider2" },
            // cells, each a group assigned to a row and column
            { key: "HeaReq", row: 2, col: 2, isGroup: true, color: "lightyellow" },
            { key: "InfReq", row: 3, col: 2, isGroup: true, color: "lightyellow" },
            { key: "ConApp", row: 3, col: 3, isGroup: true, color: "lightyellow" },
            { key: "TotApp", row: 4, col: 3, isGroup: true, color: "lightblue" },
            { key: "TotApp", row: 4, col: 4, isGroup: true, color: "lightblue" },
            // nodes, each assigned to a group/cell
            { key: "Delta", color: "orange", size: "100 100", group: "HeaReq" },
            { key: "Info", color: "orange", size: "100 100", group: "InfReq" },
            { key: "Theta", color: "tomato", size: "100 50", group: "ConApp" },                  
        	{ key: "Theta", color: "tomato", size: "100 50", group: "TotApp" }
            ]);        

Thank you for your help
Fulvio

I’ve run out of time for this. Here’s what I have so far:

    function init() {
      var $ = go.GraphObject.make;

      myDiagram =
        $(go.Diagram, "myDiagramDiv",
          {
            layout: $(TableLayout,//{ isRealtime: false },
              $(go.RowColumnDefinition, { row: 1, height: 22 }),  // fixed size column headers
              $(go.RowColumnDefinition, { column: 1, width: 22 }) // fixed size row headers
            ),
            "SelectionMoved": function(e) { e.diagram.layoutDiagram(true); },
            "resizingTool": new LaneResizingTool(),
            // feedback that dropping in the background is not allowed
            mouseDragOver: function(e) { e.diagram.currentCursor = "not-allowed"; },
            // when dropped in the background, not on a Node or a Group, cancel the drop
            mouseDrop: function(e) { e.diagram.currentTool.doCancel(); },
            "animationManager.isInitial": false,
            "undoManager.isEnabled": true
          });

      function cellBindings() {
        return [
          new go.Binding("row").makeTwoWay(),
          new go.Binding("rowSpan"),
          new go.Binding("column", "col").makeTwoWay(),
          new go.Binding("columnSpan", "colSpan"),
          new go.Binding("alignment", "align", go.Spot.parse)
        ];
      }

      myDiagram.nodeTemplateMap.add("Header",  // an overall table header, at the top
        $(go.Part, "Auto", cellBindings(),
          {
            row: 0, column: 1, columnSpan: 9999,
            stretch: go.GraphObject.Horizontal,
            selectable: false, pickable: false
          },
          $(go.Shape, { fill: "transparent", strokeWidth: 0 }),
          $(go.TextBlock, { alignment: go.Spot.Bottom, font: "bold 12pt sans-serif" },
            new go.Binding("text"))
        ));

      myDiagram.nodeTemplateMap.add("Sider",  // an overall table header, on the left side
        $(go.Part, "Auto", cellBindings(),
          {
            row: 1, rowSpan: 9999, column: 0,
            stretch: go.GraphObject.Vertical,
            selectable: false, pickable: false
          },
          $(go.Shape, { fill: "transparent", strokeWidth: 0 }),
          $(go.TextBlock, { alignment: go.Spot.Right, font: "bold 12pt sans-serif", angle: 270 },
            new go.Binding("text"))
        ));

      myDiagram.nodeTemplateMap.add("Column Header",  // for each column header
        $(go.Part, "Auto", cellBindings(),
          {
            row: 1, rowSpan: 9999, column: 2,
            layerName: "Background",
            stretch: go.GraphObject.Fill,
            background: "transparent",
            movable: false,
            resizable: true,
            resizeAdornmentTemplate:
              $(go.Adornment, "Spot",
                $(go.Placeholder),
                $(go.Shape,  // for changing the length of a lane
                  {
                    alignment: go.Spot.Right,
                    desiredSize: new go.Size(7, 50),
                    fill: "lightblue", stroke: "dodgerblue",
                    cursor: "col-resize"
                  })
              )
          },
          $(go.Shape, { fill: null, stroke: null },
            new go.Binding("fill", "color")),
          $(go.Panel, "Auto",
            { 
              alignment: go.Spot.Top, alignmentFocus: go.Spot.Top,
              stretch: go.GraphObject.Horizontal
            },
            $(go.TextBlock,
              {
                font: "bold 10pt sans-serif", textAlign: "center", isMultiline: false,
                wrap: go.TextBlock.None, overflow: go.TextBlock.OverflowEllipsis
              },
              new go.Binding("text"))
          )
        ));

      myDiagram.nodeTemplateMap.add("Row Sider",  // for each row header
        $(go.Part, "Auto", cellBindings(),
          {
            row: 2, column: 1, columnSpan: 9999,
            layerName: "Background",
            stretch: go.GraphObject.Fill,
            background: "transparent",
            movable: false,
            resizable: true,
            resizeAdornmentTemplate:
              $(go.Adornment, "Spot",
                $(go.Placeholder),
                $(go.Shape,  // for changing the breadth of a lane
                  {
                    alignment: go.Spot.Bottom,
                    desiredSize: new go.Size(50, 7),
                    fill: "lightblue", stroke: "dodgerblue",
                    cursor: "row-resize"
                  })
              )
          },
          $(go.Shape, { fill: null, stroke: null },
            new go.Binding("fill", "color")),
          $(go.Panel, "Auto",
            {
              alignment: go.Spot.Left, alignmentFocus: go.Spot.Left,
              stretch: go.GraphObject.Vertical, angle: 270,
            },
            $(go.TextBlock,
              {
                font: "bold 10pt sans-serif", textAlign: "center", isMultiline: false,
                wrap: go.TextBlock.None, overflow: go.TextBlock.OverflowEllipsis
              },
              new go.Binding("text"))
          )
        ));

      myDiagram.nodeTemplate =  // for regular nodes within cells (groups); you'll want to extend this
        $(go.Node, "Auto", cellBindings(),
          { width: 100, height: 30, margin: 4 },  // assume uniform Margin, all around
          $(go.Shape, { fill: "white" },
            new go.Binding("fill", "color")),
          $(go.TextBlock,
            new go.Binding("text"))
        );

      myDiagram.groupTemplate =  // for cells
        $(go.Group, "Auto", cellBindings(),
          {
            layerName: "Background",
            stretch: go.GraphObject.Fill,
            selectable: false,
            computesBoundsAfterDrag: true,
            computesBoundsIncludingLocation: true,
            handlesDragDropForMembers: true,  // don't need to define handlers on member Nodes and Links
            mouseDragEnter: function(e, group, prev) { group.isHighlighted = true; },
            mouseDragLeave: function(e, group, next) { group.isHighlighted = false; },
            mouseDrop: function(e, group) {
              // if any dropped part wasn't already a member of this group, we'll want to let the group's row
              // column allow themselves to be resized automatically, in case the row height or column width
              // had been set manually by the LaneResizingTool
              var anynew = e.diagram.selection.any(function(p) { return p.containingGroup !== group; });
              // Don't allow headers/siders to be dropped
              var anyHeadersSiders = e.diagram.selection.any(function(p) {
                return p.category === "Column Header" || p.category === "Row Sider";
              });
              if (!anyHeadersSiders && group.addMembers(e.diagram.selection, true)) {
                if (anynew) {
                  e.diagram.layout.getRowDefinition(group.row).height = NaN;
                  e.diagram.layout.getColumnDefinition(group.column).width = NaN;
                }
              } else {  // failure upon trying to add parts to this group
                e.diagram.currentTool.doCancel();
              }
            }
          },
          new go.Binding("row"),
          new go.Binding("column", "col"),
          // the group is normally unseen -- it is completely transparent except when given a color or when highlighted
          $(go.Shape,
            {
              fill: "transparent", stroke: "transparent",
              strokeWidth: myDiagram.nodeTemplate.margin.left,
              stretch: go.GraphObject.Fill
            },
            new go.Binding("fill", "color"),
            new go.Binding("stroke", "isHighlighted", function(h) { return h ? "red" : "transparent"; }).ofObject()),
          $(go.Placeholder,
            { // leave a margin around the member nodes of the group which is the same as the member node margin
              alignment: (function(m) { return new go.Spot(0, 0, m.top, m.left); })(myDiagram.nodeTemplate.margin),
              padding: (function(m) { return new go.Margin(0, m.right, m.bottom, 0); })(myDiagram.nodeTemplate.margin)
            })
        );

      myDiagram.model = new go.GraphLinksModel([
        // headers
        { text: "Report Pivot Content", category: "Header", col: 1, colSpan: 2 },
        // column and row headers
        { text: "", col: 2, category: "Column Header", row: 1 },
        { text: "Columns", col: 3, category: "Column Header", row: 2 },
        { text: "Header", row: 2, category: "Row Sider" },
        { text: "Info", row: 3, category: "Row Sider" },
        { text: "Administrator", row: 4, category: "Row Sider", col: 2 },
        // cells, each a group assigned to a row and column
        { key: "2-2", row: 2, col: 2, isGroup: true, color: "lightyellow" },
        //{ key: "2-3", row: 2, col: 3, isGroup: true, color: "lightgreen" },
        { key: "3-2", row: 3, col: 2, isGroup: true, color: "lightgreen" },
        { key: "3-3", row: 3, col: 3, isGroup: true, color: "lightyellow" },
        //{ key: "4-2", row: 4, col: 2, isGroup: true, color: "lightyellow" },
        { key: "4-3", row: 4, col: 3, isGroup: true, color: "lightgreen" },
        // nodes, each assigned to a group/cell
        { text: "Delta", color: "orange", size: "100 100", group: "2-2" },
        { text: "Epsilon", color: "coral", size: "100 50", group: "3-2" },
        { text: "Zeta", color: "tomato", size: "50 70", group: "3-3" },
        { text: "Eta", color: "coral", size: "50 50", group: "3-3" },
        { text: "Theta", color: "tomato", size: "100 50", group: "4-3" }
      ]);

      myPalette =
        $(go.Palette, "myPaletteDiv",
          {
            nodeTemplateMap: myDiagram.nodeTemplateMap,
            "model.nodeDataArray": [
              { text: "Alpha", color: "orange" },
              { text: "Beta", color: "tomato" },
              { text: "Gamma", color: "goldenrod" }
            ]
          });
    }

The result:
image

Hi Walter,
first thank you for your help and time spent. I’m sorry probably I forgot to give you more infos on groups involved because with your example all the groups are mixed and the bounds of all cells completely disapperared …
Here my example with where each select group:
group 1


group 2

group 3

group 4

what I need is to “close” open cell bounds (for example “Header”) and put the text “Columns” closer
to cell with yellow background… I also created a new row header (“Total”) with a different rowspan than the group 1 and group 3… Also in this case I need to put text “Total” closer to lightblue cell without blank spaces in the middle… P.S.I don’t need a palette from which drag object into canvas because a take object from outside the canvas with some html tricks, but this is not a problem :-)
I hope I was clear, if not sorry for my bad english…
Thx in advance
F.

What I was going to try next was to implement “Columns” and “Total” as separate objects, each in its own cell, rather than representing an almost whole column or an almost whole row.

If you don’t need to allow the user to select and resize a row or a column, that would be easy.

Yes, as you rightly say I don’t want to allow users resize entire group but when I drop an object in a cell I want the cell automatically autoresize, meaning for that that the object dropped in will transform itself in a horizontal or vertical text list so probably the cell must extend automatically in horizontal or vertical mode, is it possible? Is also possible to prevent group deletion for some group? My goal is to create a visual matrix where deleting a group (ex: Info) can transform a pivot table in a tabular table, but preventing to delete “Columns” group, just to be clear… cells must have borders I realized now that I was speaking about borders and not bounds, sorry

You can set the Group.layout to arrange the members of the group/cell how you like.

If you take a look at the template, Groups are currently not selectable, which automatically makes them not deletable. If it were needed, you could set deletable to false.

Ok, is there an example of how to set group.layout? My fault: for “groups” I mean group of cells, like row header or column header that contains one or more cells…these “groups” are selectable, resizable and deletable, and that is what I want to control…
By the way how can I arrange these “glitches” on the borders of the cells and the space between title and cells? (image below with circled glitches):


Is possible create a fixed matrix with bordered cells that can’t be resized from users but can automatically be resized depending on content dropped in? Can I delete only “Info” row header (I don’t want the user to delete the other groups) and related cell without creating a mess?
Thx

That really is what the Table Layout sample demonstrates: Table Layout

One difference is that you are using the “Column Header” and “Row Sider” templates in a manner for which they were not intended – the headers are only supposed to be in row 1 or column 1.

The problem at the bottom right is because your model includes something in that column and row. Remove it and that artifact goes away.

If we remove all of those features that I believe you are saying you don’t need, the app gets much simpler. I have also added a GridLayout as the Group.layout, and I have added a border around each cell (i.e. in the Group template). Try the following code:

<!DOCTYPE html>
<html>
<head>
  <title>Table Layout</title>
  <!-- Copyright 1998-2021 by Northwoods Software Corporation. -->
  <meta name="description" content="Use the TableLayout extension to arrange nodes in a tabular or grid-like form." />
  <meta name="viewport" content="width=device-width, initial-scale=1">
  <script src="https://unpkg.com/gojs"></script>
  <script src="https://unpkg.com/gojs/extensions/TableLayout.js"></script>

  <script id="code">
    function init() {
      var $ = go.GraphObject.make;

      myDiagram =
        $(go.Diagram, "myDiagramDiv",
          {
            layout: $(TableLayout, { isRealtime: false },
              $(go.RowColumnDefinition, { row: 1, height: 22 }),  // fixed size column headers
              $(go.RowColumnDefinition, { column: 1, width: 22 }) // fixed size row headers
            ),
            // feedback that dropping in the background is not allowed
            mouseDragOver: function(e) { e.diagram.currentCursor = "not-allowed"; },
            // when dropped in the background, not on a Node or a Group, cancel the drop
            mouseDrop: function(e) { e.diagram.currentTool.doCancel(); },
            "animationManager.isInitial": false,
            "undoManager.isEnabled": true
          });

      function cellBindings() {
        return [
          new go.Binding("row").makeTwoWay(),
          new go.Binding("rowSpan"),
          new go.Binding("column", "col").makeTwoWay(),
          new go.Binding("columnSpan", "colSpan"),
          new go.Binding("alignment", "align", go.Spot.parse)
        ];
      }

      myDiagram.nodeTemplateMap.add("Header",  // an overall table header, at the top
        $(go.Part, "Auto", cellBindings(),
          {
            row: 0, column: 1, columnSpan: 9999,
            stretch: go.GraphObject.Horizontal,
            selectable: false, pickable: false
          },
          $(go.Shape, { fill: "transparent", strokeWidth: 0 }),
          $(go.TextBlock, { alignment: go.Spot.Bottom, font: "bold 12pt sans-serif" },
            new go.Binding("text"))
        ));

      myDiagram.nodeTemplateMap.add("Sider",  // an overall table header, on the left side
        $(go.Part, "Auto", cellBindings(),
          {
            row: 1, rowSpan: 9999, column: 0,
            stretch: go.GraphObject.Vertical,
            selectable: false, pickable: false
          },
          $(go.Shape, { fill: "transparent", strokeWidth: 0 }),
          $(go.TextBlock, { alignment: go.Spot.Right, font: "bold 12pt sans-serif", angle: 270 },
            new go.Binding("text"))
        ));

      myDiagram.nodeTemplateMap.add("Column Header",  // for each column header
        $(go.Part, "Auto", cellBindings(),
          {
            row: 1,
            layerName: "Background",
            stretch: go.GraphObject.Horizontal,
            alignment: go.Spot.Bottom,
            background: "transparent",
            selectable: false
          },
          $(go.TextBlock,
            {
              font: "bold 10pt sans-serif", textAlign: "center", isMultiline: false,
              wrap: go.TextBlock.None, overflow: go.TextBlock.OverflowEllipsis
            },
            new go.Binding("text"))
        ));

      myDiagram.nodeTemplateMap.add("Row Sider",  // for each row header
        $(go.Part, "Auto", cellBindings(),
          {
            column: 1,
            layerName: "Background",
            stretch: go.GraphObject.Vertical,
            alignment: go.Spot.Right,
            background: "transparent",
            selectable: false
          },
          $(go.Shape, { fill: null, stroke: null },
            new go.Binding("fill", "color")),
          $(go.TextBlock,
            {
              font: "bold 10pt sans-serif", textAlign: "center", angle: 270,
              isMultiline: false, wrap: go.TextBlock.None, overflow: go.TextBlock.OverflowEllipsis
            },
            new go.Binding("text"))
        ));

      myDiagram.nodeTemplate =  // for regular nodes within cells (groups); you'll want to extend this
        $(go.Node, "Auto", cellBindings(),
          { width: 100, height: 30, margin: 4 },  // assume uniform Margin, all around
          $(go.Shape, { fill: "white" },
            new go.Binding("fill", "color")),
          $(go.TextBlock,
            new go.Binding("text"))
        );

      myDiagram.groupTemplate =  // for cells
        $(go.Group, "Auto", cellBindings(),
          {
            layerName: "Background",
            stretch: go.GraphObject.Fill,
            selectable: false,
            layout: $(go.GridLayout, { wrappingColumn: 1 }),
            computesBoundsAfterDrag: true,
            computesBoundsIncludingLocation: true,
            handlesDragDropForMembers: true,  // don't need to define handlers on member Nodes and Links
            mouseDragEnter: function(e, group, prev) { group.isHighlighted = true; },
            mouseDragLeave: function(e, group, next) { group.isHighlighted = false; },
            mouseDrop: function(e, group) {
              // if any dropped part wasn't already a member of this group, we'll want to let the group's row
              // column allow themselves to be resized automatically, in case the row height or column width
              // had been set manually by the LaneResizingTool
              var anynew = e.diagram.selection.any(function(p) { return p.containingGroup !== group; });
              // Don't allow headers/siders to be dropped
              var anyHeadersSiders = e.diagram.selection.any(function(p) {
                return p.category === "Column Header" || p.category === "Row Sider";
              });
              if (!anyHeadersSiders && group.addMembers(e.diagram.selection, true)) {
                if (anynew) {
                  e.diagram.layout.getRowDefinition(group.row).height = NaN;
                  e.diagram.layout.getColumnDefinition(group.column).width = NaN;
                }
                e.diagram.layout.invalidateLayout();
              } else {  // failure upon trying to add parts to this group
                e.diagram.currentTool.doCancel();
              }
            }
          },
          new go.Binding("row"),
          new go.Binding("column", "col"),
          // the group is normally unseen -- it is completely transparent except when given a color or when highlighted
          $(go.Shape,
            {
              fill: "transparent", stroke: "gray",
              stretch: go.GraphObject.Fill
            },
            new go.Binding("fill", "color"),
            new go.Binding("fill", "isHighlighted",
                           function(h, shape) { return h ? "red" : shape.part.data.color; }).ofObject()),
          $(go.Placeholder,
            { // leave a margin around the member nodes of the group which is the same as the member node margin
              alignment: (function(m) { return new go.Spot(0, 0, m.top, m.left); })(myDiagram.nodeTemplate.margin),
              padding: (function(m) { return new go.Margin(0, m.right, m.bottom, 0); })(myDiagram.nodeTemplate.margin)
            })
        );

      myDiagram.model = new go.GraphLinksModel([
        // headers
        { text: "Report Pivot Content", category: "Header", col: 1, colSpan: 2 },
        // column and row headers
        { text: "", col: 2, category: "Column Header", row: 1 },
        { text: "Columns", col: 3, category: "Column Header", row: 2 },
        { text: "Header", row: 2, category: "Row Sider" },
        { text: "Info", row: 3, category: "Row Sider" },
        { text: "Administrator", row: 4, category: "Row Sider", col: 2 },
        // cells, each a group assigned to a row and column
        { key: "2-2", row: 2, col: 2, isGroup: true, color: "lightyellow" },
        //{ key: "2-3", row: 2, col: 3, isGroup: true, color: "lightgreen" },
        { key: "3-2", row: 3, col: 2, isGroup: true, color: "lightgreen" },
        { key: "3-3", row: 3, col: 3, isGroup: true, color: "lightyellow" },
        //{ key: "4-2", row: 4, col: 2, isGroup: true, color: "lightyellow" },
        { key: "4-3", row: 4, col: 3, isGroup: true, color: "lightgreen" },
        // nodes, each assigned to a group/cell
        { text: "Delta", color: "orange", size: "100 100", group: "2-2" },
        { text: "Epsilon", color: "coral", size: "100 50", group: "3-2" },
        { text: "Zeta", color: "tomato", size: "50 70", group: "3-3" },
        { text: "Eta", color: "coral", size: "50 50", group: "3-3" },
        { text: "Theta", color: "tomato", size: "100 50", group: "4-3" }
      ]);
    }
  </script>
</head>
<body onload="init()">
<div id="sample">
  <div id="myDiagramDiv" style="width: 100%; height: 600px; border: solid 1px black"></div>
</div>
</body>
</html>

which results in:
image

Thank you Walter, that fits graphically what I need but in this way I guess I have to create in advance the grid to show…that would be perfect if I could select and delete (just this) the “administrator” and “Info” cells with their contents without having to preconstruct the grid in the “init” fase… do you think is possible create different “row siders” for “Info” and “Administrator” cells giving them selectable and deletable properties? Of course is possible choose different graphical view depending on what you select in preceeding navigation (f.e. if you choose “Tabular” the canvas won’t show “Info” section etc…) but if there was more interactivity it would be better graphicaly speaking…

Did you want the user to select either “Info” or “Administrator” and be able to delete the whole row, cells and nodes?

If so, you can do that by implementing a “SelectionDeleting” DiagramEvent listener that, for each “Row Sider” or “Column Header” selects the Group cells in the corresponding row or column.

Is there an example? I think it is beyond my abilities… :-(
Thx

I think there is at least one in the samples directory.

thanks for your time Walter
ciao
F

Just one thing: from the selected “row sider” how can I delete the rest of the involved part (cells, objects) it’s not very clear for me the structure of the object tree…

Just look for all Groups that have the desired row or column value. Removing a Group will automatically remove all of its member Parts.

I haven’t tried this, but maybe:

myDiagram.commit(diag => {
    diag.removeCollection(myDiagram.nodes.filter(n => n.row = someRow));
  });