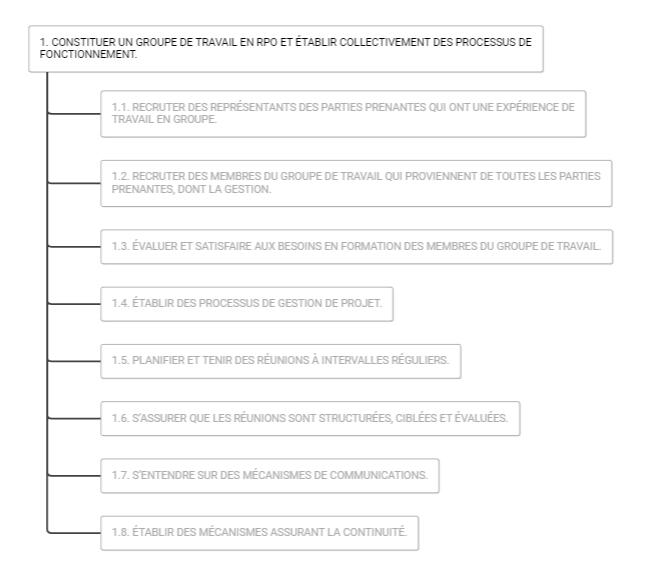
Hi, I am plotting tree layout with gojs in vue. When I first built the page, everything work fine and it is supposed to show as the following pic:
But later I added some other functions to this page, and occasionally(about once every 5 times) when I enter this page, the render seems to be slower and it gives a bad gojs tree diagram.
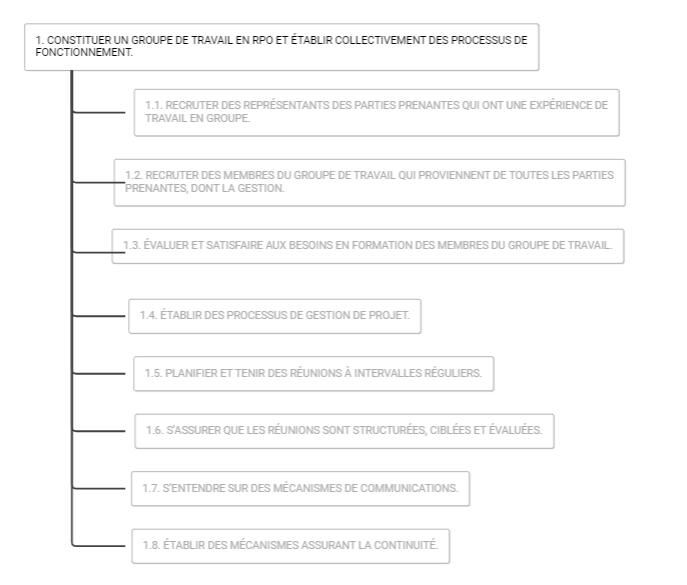
I tried to delete all those new functions but the problem is not solved. Does anybody know what is the possible cause of the problem? Am I doing anything wrong or is the website/page kinda overwhelmed which leads to the bad plot…?
- Summary.vue
<template>
  <v-container>
    <v-row justify="center">
      <v-col cols="12" sm="10" md="10" lg="10" xl="8">
        <div class="d-flex justify-space-between my-4" style="flex-wrap:wrap">
          <v-btn text large color="primary" class="mx-2" @click="toGuidePage()">
              <v-icon left color="primary">mdi-arrow-left</v-icon>
              {{$t('summary.btn_modify')}}
          </v-btn>
          <v-spacer></v-spacer>
          <v-btn text large color="primary"  @click="generatePdf()">
              {{$t('summary.btn_download')}}
              <v-icon right color="primary">mdi-download</v-icon>
          </v-btn>
        </div>
        <v-row justify="center">
          <v-col cols="12" sm="12" md="10" lg="10" xl="10">
            <v-alert
              text
              color="info"
              :value="download_success"
              transition="scale-transition"
            >
              <v-row
                align="center"
              >
                <v-col class="grow">{{$t('summary.download_prompt')}} </v-col>
                <v-col class="shrink">
                  <v-btn
                    color="info"
                    outlined
                    @click="toFeedbackPage"
                  >
                    {{$t('summary.btn_feedback')}}
                  </v-btn>
                </v-col>
              </v-row>
            </v-alert>
            <div class="d-flex justify-space-between my-4" style="flex-wrap:wrap">
              <div
                class="mr-2">
                <h2>{{$t('summary.title_header')}}</h2>
                <v-text-field
                  class="my-12 mx-2"
                  outlined
                  :label="$t('summary.title_header')"
                  v-model="pdf_title"
                ></v-text-field>
              </div>
              <div>
                <h2>{{$t('summary.title_logo')}}</h2>
                <input type="file" @change="uploadImage($event)">
                <canvas id="logo_canvas" v-if="logo_uploaded"></canvas>
              </div>
            </div>
            <h2 class="my-4">{{$t('summary.title_summary')}}</h2>
            <TreeDiagram id="sum-diagram" ref="diag" v-bind:model-data="diagram_data" style=""></TreeDiagram>
          </v-col>
        </v-row>
      </v-col>
    </v-row>
  </v-container>
</template>

<script>
import jsPDF from 'jspdf'
import $ from 'jquery'
import go from 'gojs'
import TreeDiagram from './TreeDiagram.vue'
import {mapState, mapMutations} from 'vuex'
export default {
  name: 'Summary',

  components: {
    TreeDiagram,
  },

  data: () => ({
    pdf_title: "",
    logo_data: null,
    logo_width: 1,
    logo_height: 1,
    logo_uploaded: false,
    download_success: false
  }),

  computed:{
    ...mapState([
      'diagram_data',
      'diagram_height',
      'diagram_width',
      'diagram_title'])
  },

  mounted: function() {
    this.pdf_title = this.$t('summary.default_pdf_title');
  },

  methods: {
    ...mapMutations([
      'setStepperStep',
    ]),

    toGuidePage() {
      this.setStepperStep(0);
      this.$router.push('/guide');
    },

    uploadImage(e){
      this.logo_uploaded = true;
      var files = e.target.files || e.dataTransfer.files;
      if (!files.length)
        return;
      var reader = new FileReader();
      var self = this;
      reader.onload = (e) => {
        this.drawImage(self, e.target.result);
      };
      reader.readAsDataURL(files[0]);
    },

    drawImage(self, image_src) {
      var image = new Image();
      image.src = image_src;
      image.onload = function(){
        self.logo_height = image.height;
        self.logo_width = image.width;
        var canvas = $('#logo_canvas')[0];
        var context = canvas.getContext('2d');
        canvas.height = 150;
        canvas.width = canvas.height*image.width/image.height;
        context.drawImage(image, 0, 0, image.width, image.height,
          0, 0, canvas.width, canvas.height);
        self.logo_data = canvas.toDataURL('image/png');
      }
    },

    generatePdf() {
      var pageData = this.$refs.diag.diagram.makeImage({
        scale: 1,
        type: "image / jpeg",
        background: "white",
        maxSize: new go.Size(Infinity, Infinity),
        details: 1
      });
      var margin = 30;

      var contentWidth = this.diagram_width;
      var contentHeight = this.diagram_height;

      var imgWidth = 210 - 2*margin;
      var pageHeight = 295;
      var imgHeight = contentHeight * imgWidth / contentWidth;
      var heightLeft = imgHeight;

      var doc = new jsPDF('p', 'mm');
      var position = 40;

      //print logo
      if(this.logo_data!==null){
        var logo_height_inpdf = 20;
        var logo_width_inpdf = logo_height_inpdf * this.logo_width / this.logo_height;
        doc.addImage(this.logo_data, "JPEG", 20, 2, logo_width_inpdf, logo_height_inpdf);
      }

      //print title
      var title = doc.splitTextToSize(this.pdf_title, 100)
      doc.setFontType("bold");
      doc.setFont("arial");
      doc.setFontSize(24);
      doc.text(this.logo_data===null?30:(30+logo_width_inpdf), 15, title);

      //print diagram
      doc.addImage(pageData, 'PNG', margin, position, imgWidth, imgHeight);

      heightLeft -= pageHeight - position;

      while (heightLeft >= 0) {
        position = heightLeft - imgHeight;
        doc.addPage();
        doc.addImage(pageData, 'PNG', margin, position, imgWidth, imgHeight);
        heightLeft -= pageHeight;
      }
      doc.save('Guide_Diagram.pdf');
      this.download_success = true;
    },

    toFeedbackPage(){
      this.$router.push('/feedback');
    }
  }
};
</script>
- TreeDiagram.vue
<template>
  <div>
  </div>
</template>

<script>
import {mapMutations} from 'vuex'
import go from 'gojs';
export default {
  name: "TreeDiagram",
  data: () => ({
    diagram: '',
    roundedRectangleParams: '',
  }),
  props: ["modelData"],
  mounted: function() {
    let $ = go.GraphObject.make;
    // var is_mobile = this.is_mobile;
    this.roundedRectangleParams = {
      parameter1: 2,
      spot1: go.Spot.TopLeft, spot2: go.Spot.BottomRight
    };
    var myDiagram = $(go.Diagram, this.$el,
      {
        initialDocumentSpot: go.Spot.TopCenter,
        initialViewportSpot: go.Spot.TopCenter,
        hasVerticalScrollbar: false,
        padding: new go.Margin(56,0,56,0),
        isReadOnly: true,
        "ViewportBoundsChanged": function() {
          myDiagram.allowHorizontalScroll = false;
          myDiagram.allowVerticalScroll = false;
        },
        "InitialLayoutCompleted": this.loadDiagramProperties,
        layout:
          $(go.TreeLayout,
            {
              angle: 0,
              alignment: go.TreeLayout.AlignmentStart,
              nodeIndent: 20,
              nodeIndentPastParent: 1,
              nodeSpacing: 25,
              layerSpacing: 80,
              layerSpacingParentOverlap: 1,
              arrangementSpacing: new go.Size(0,50),
              portSpot: new go.Spot(0.001, 1, 20, 0),
              childPortSpot: go.Spot.Left
            })
      });
    myDiagram.toolManager.panningTool.isEnabled = false;

    myDiagram.nodeTemplate =
        $(go.Node, "Auto",
          {
            locationSpot: go.Spot.TopCenter,
            isShadowed: true, shadowBlur: 1,
            shadowOffset: new go.Point(1, 1),
            shadowColor: "rgba(0, 0, 0, .14)",
            selectionAdornmentTemplate:
              $(go.Adornment, "Auto",
                $(go.Shape, "RoundedRectangle", this.roundedRectangleParams,
                  { fill: null, stroke: "#7986cb", strokeWidth: 1 }
                ),
                $(go.Placeholder)
              )
          },
          $(go.Shape, "RoundedRectangle", this.roundedRectangleParams,
            { name: "SHAPE", fill: "#ffffff", strokeWidth: 1, stroke: "#adadad" },
          ),
          $(go.Panel, "Vertical",
            { maxSize: new go.Size(600, Infinity), },
            $(go.Panel, "Horizontal",
              { maxSize: new go.Size(600, Infinity), padding: 12, alignment: go.Spot.LeftCenter},
              $(go.Picture,
                { source: "selected.png", width: 20, height: 20},
                new go.Binding("visible", "", function(data){ return data.selected&&!data.isParent;})
              ),
              $(go.TextBlock,
                {
                  font: "12px Roboto",
                  wrap: go.TextBlock.WrapFit,
                  isMultiline: true,
                  maxSize: new go.Size(550, Infinity)
                },
                new go.Binding("text", "substep"),
                new go.Binding("stroke", "selected", function(selected){ return selected ? "#424242":"#adadad"})
              )
            ),
            $(go.Shape, "LineH",
              {
                stroke: "rgba(0, 0, 0, .60)", strokeWidth: 1,
                height: 1, stretch: go.GraphObject.Horizontal
              },
              new go.Binding("visible", "", function(data) { return data.comment!=""&&!data.isParent})
            ),
            $(go.TextBlock,
            {
                font: "12px verdana",
                wrap: go.TextBlock.WrapFit,
                isMultiline: true,
                maxSize: new go.Size(550, Infinity),
                margin : new go.Margin(10, 10, 10, 10)
            },
              new go.Binding("stroke", "selected", function(selected){ return selected ? "#424242":"#adadad"}),
              new go.Binding("text", "comment"),
              new go.Binding("visible", "" , function(data) { return (data.comment!==""&&data.comment!==undefined)&&!data.isParent;}),
            ),
          ),
        );

    myDiagram.linkTemplate =
        $(go.Link, go.Link.Orthogonal,
          { corner: 5, selectable: false },
          $(go.Shape, { strokeWidth: 2, stroke: "#424242" }),
          );
    myDiagram.model =
      $(go.TreeModel,
        {
          nodeParentKeyProperty: "parent",
          nodeDataArray: this.modelData,
        });
    this.diagram = myDiagram;
  },
  watch: {
  },
  methods: {
    model: function() {
     return this.diagram.model;
    },
    ...mapMutations([
      'setDiagramSize',
      'setDiagramTitle'
    ]),
    loadDiagramProperties: function(e) {
      var dia = e.diagram;
      dia.div.style.height = (dia.documentBounds.height+24) + "px";
      this.setDiagramSize({height: dia.documentBounds.height+24, width: dia.documentBounds.width});
      this.setDiagramTitle(this.$t('home.text_title'));
    }

  }
}
</script>