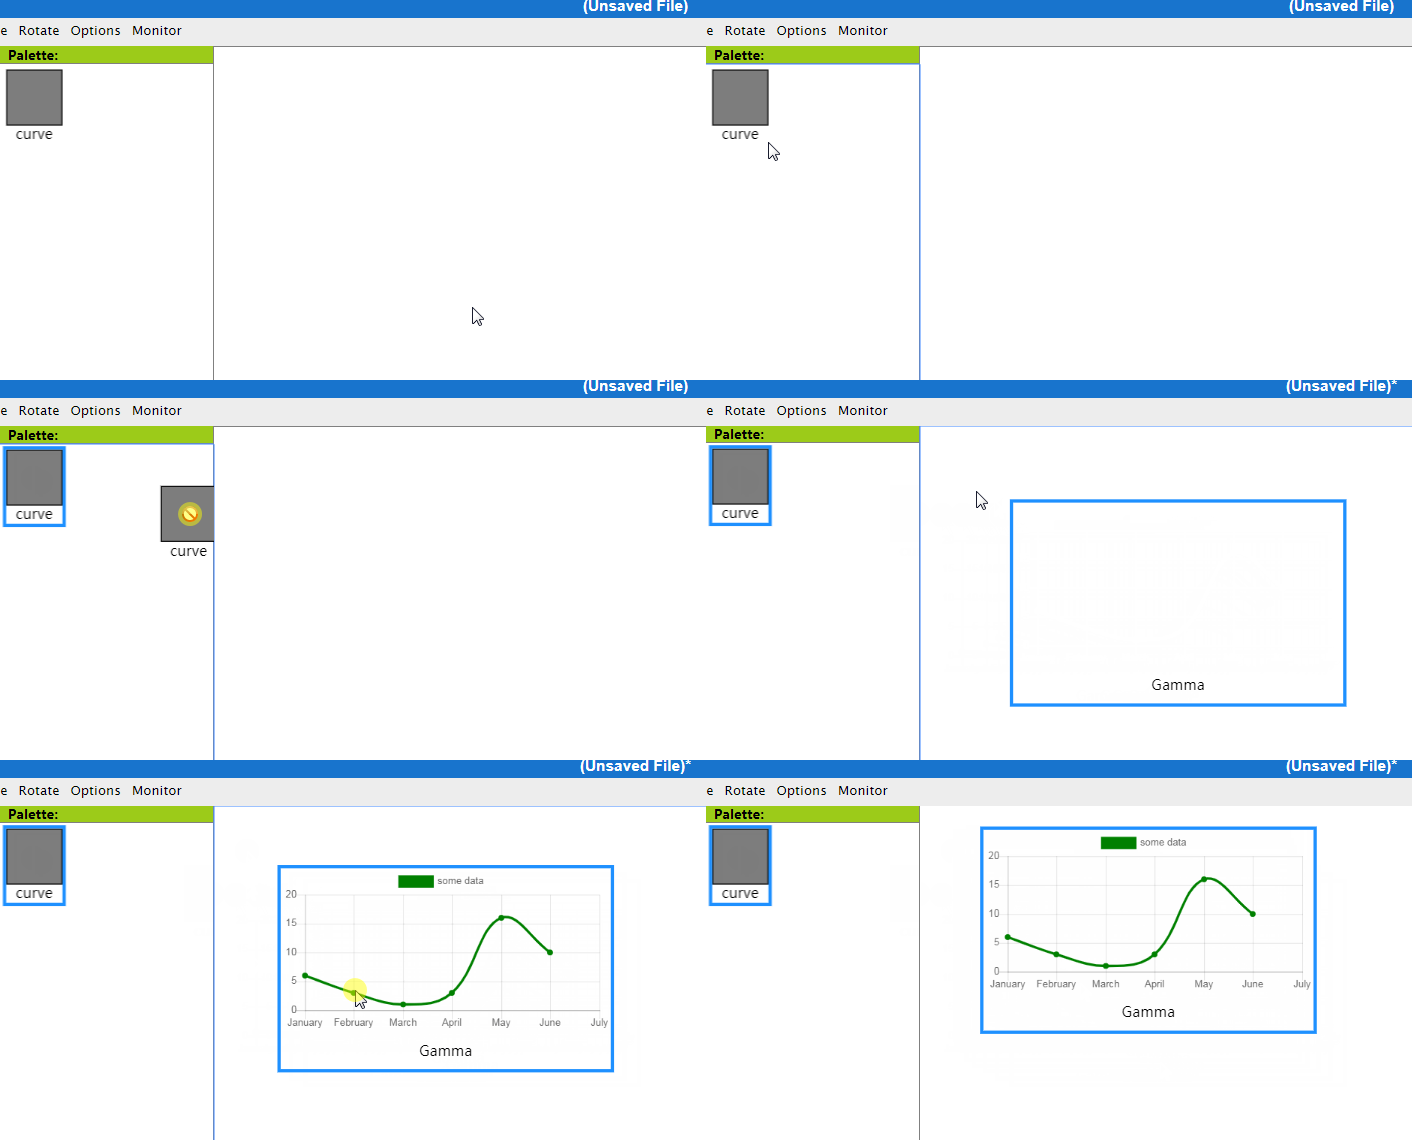
I combined the two examples of FloorPlanEditor and Canvases chart.
During the dragging process, the chart can be displayed normally. When the chart is dropped, it disappears, then if I click on other areas, it appears again.

I combined the two examples of FloorPlanEditor and Canvases chart.
During the dragging process, the chart can be displayed normally. When the chart is dropped, it disappears, then if I click on other areas, it appears again.

In the chart.js options you’re going to have to add two redraw statements to force GoJS to update when the HTML Canvas that manages the chart.js chart updates:
          options: {
            animation: {
              onProgress: function() {
                myDiagram.redraw(); // !!
              },
              onComplete: function() {
                myDiagram.redraw(); // !!
                ...
This is not ideal, but it’s the only way of notifying GoJS that an underlying canvas has changed. It is necessary because animation is on by default for chart.js, so you could also solve the problem by turning that off.
Unfortunately you will see the chart.js animation happen twice: Once for the temporary node created by dragging, and once for the real node created once a drop is accepted.
Working example: https://codepen.io/simonsarris/pen/RzqNjw
thank you very much for your help.