Hi,
I’ve been using GoJS for some time now in my company’s project.
At the moment, I am upgrading from 2.3.10 to 3.0.8.
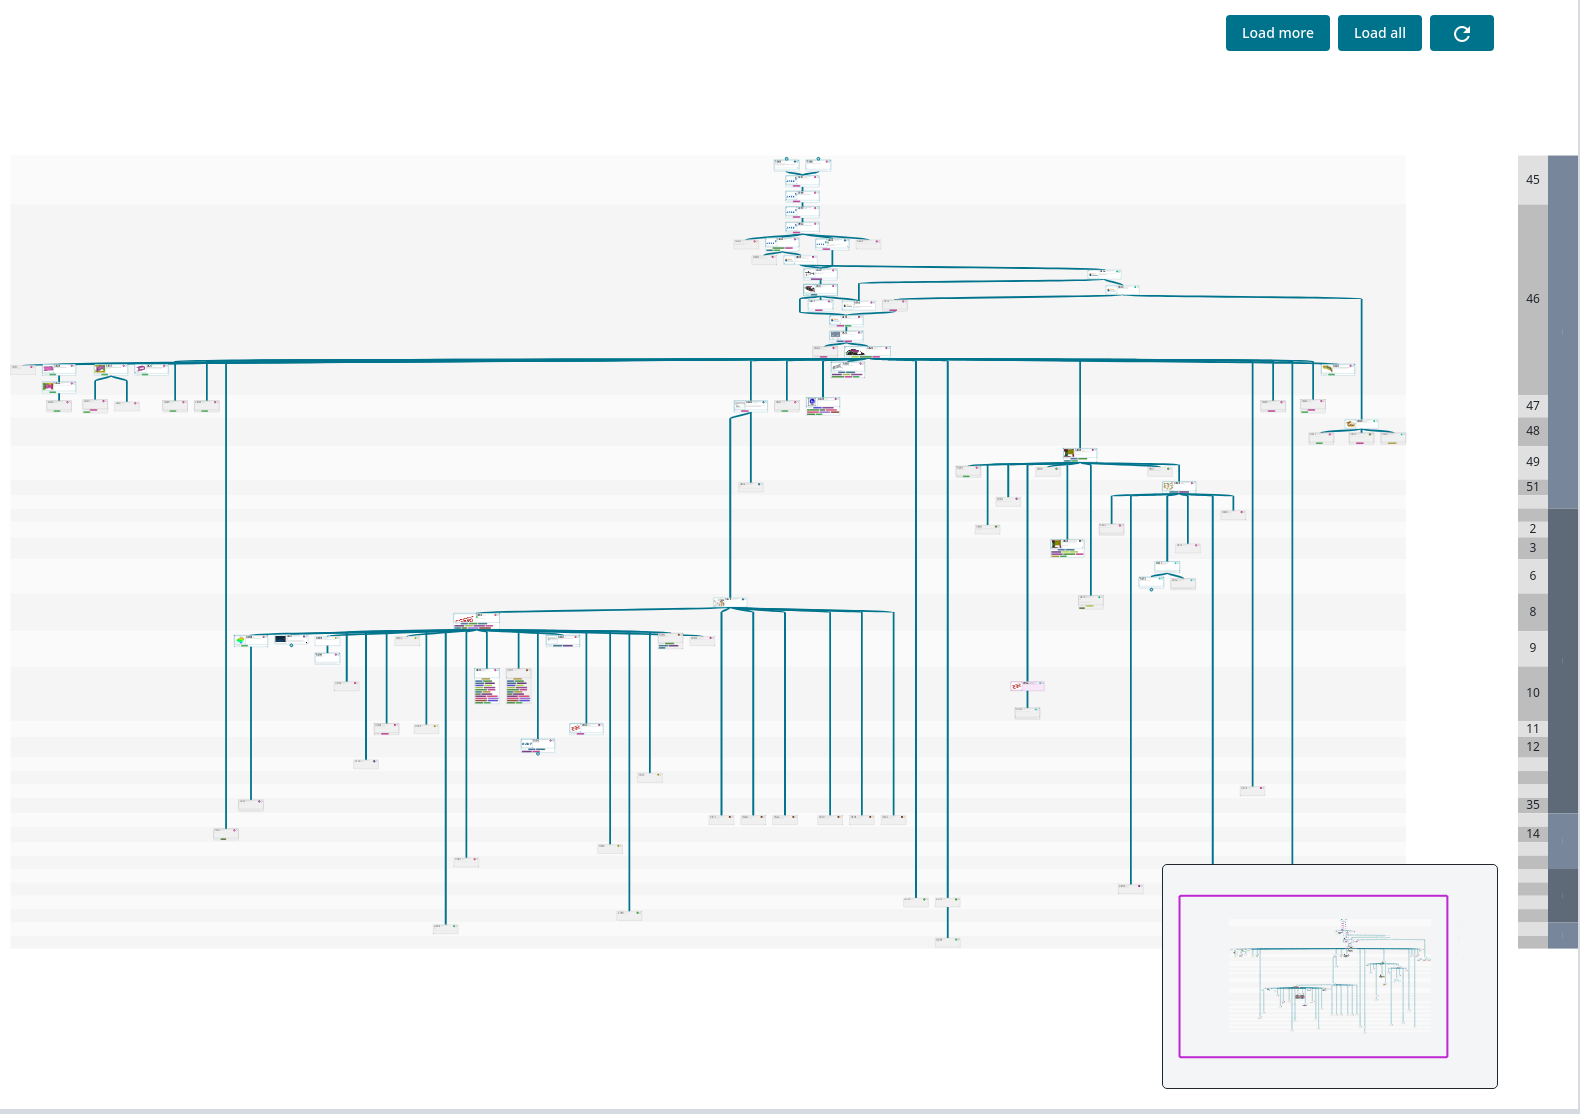
For my diagram (see example screenshot below) I am using a layout derived from the LayeredDigraphLayout and I noticed major improvements concerning node layout with the update. So I want to say thanks to that, because this was an open issue on my end.
That being said, I am now facing performance issues with the layout in the updated version compared to the previous version.
One issue is long loading times when adding many nodes (~2500) and links between those to the diagram model. Before the update, this was done in about 40 to 50 seconds. Now it is about 4 to (under some circumstance) 8 minutes.
The other is decreased performance when zooming (and panning after the diagram has been zoomed).
Focusing on the first issue for now, following the documentation of the LayeredDigraphLayout concerning the major options that affect the layout, I tried different combinations of the following options:
- alignOption
- layeringOption
- aggressiveOption
For the first option, LayeredDigraphAlign.All seems to be the best value with respect to layout of nodes as well as performance. So I actually only compared LayeredDigraphAlign.All and LayeredDigraphAlign.None, with the former giving much better results while also having way better performance (about a factor of 5).
The second option produces the best results when using LayeredDigraphLayering.OptimalLinkLength. Using the other available options (LongestPathSource and LongestPathSink), turned out to not affect the performance in a significant way.
Lastly, for the aggressiveOption, trying out the different options seemed to have the biggest performance impact, while LayeredDigraphAggressive.Less seems to offer a good balance between result and performance. Using None had an increased performance by a factor of about 3 to 4 while the result was still acceptable.
I would, however, like to ask you for help concerning the performance here.
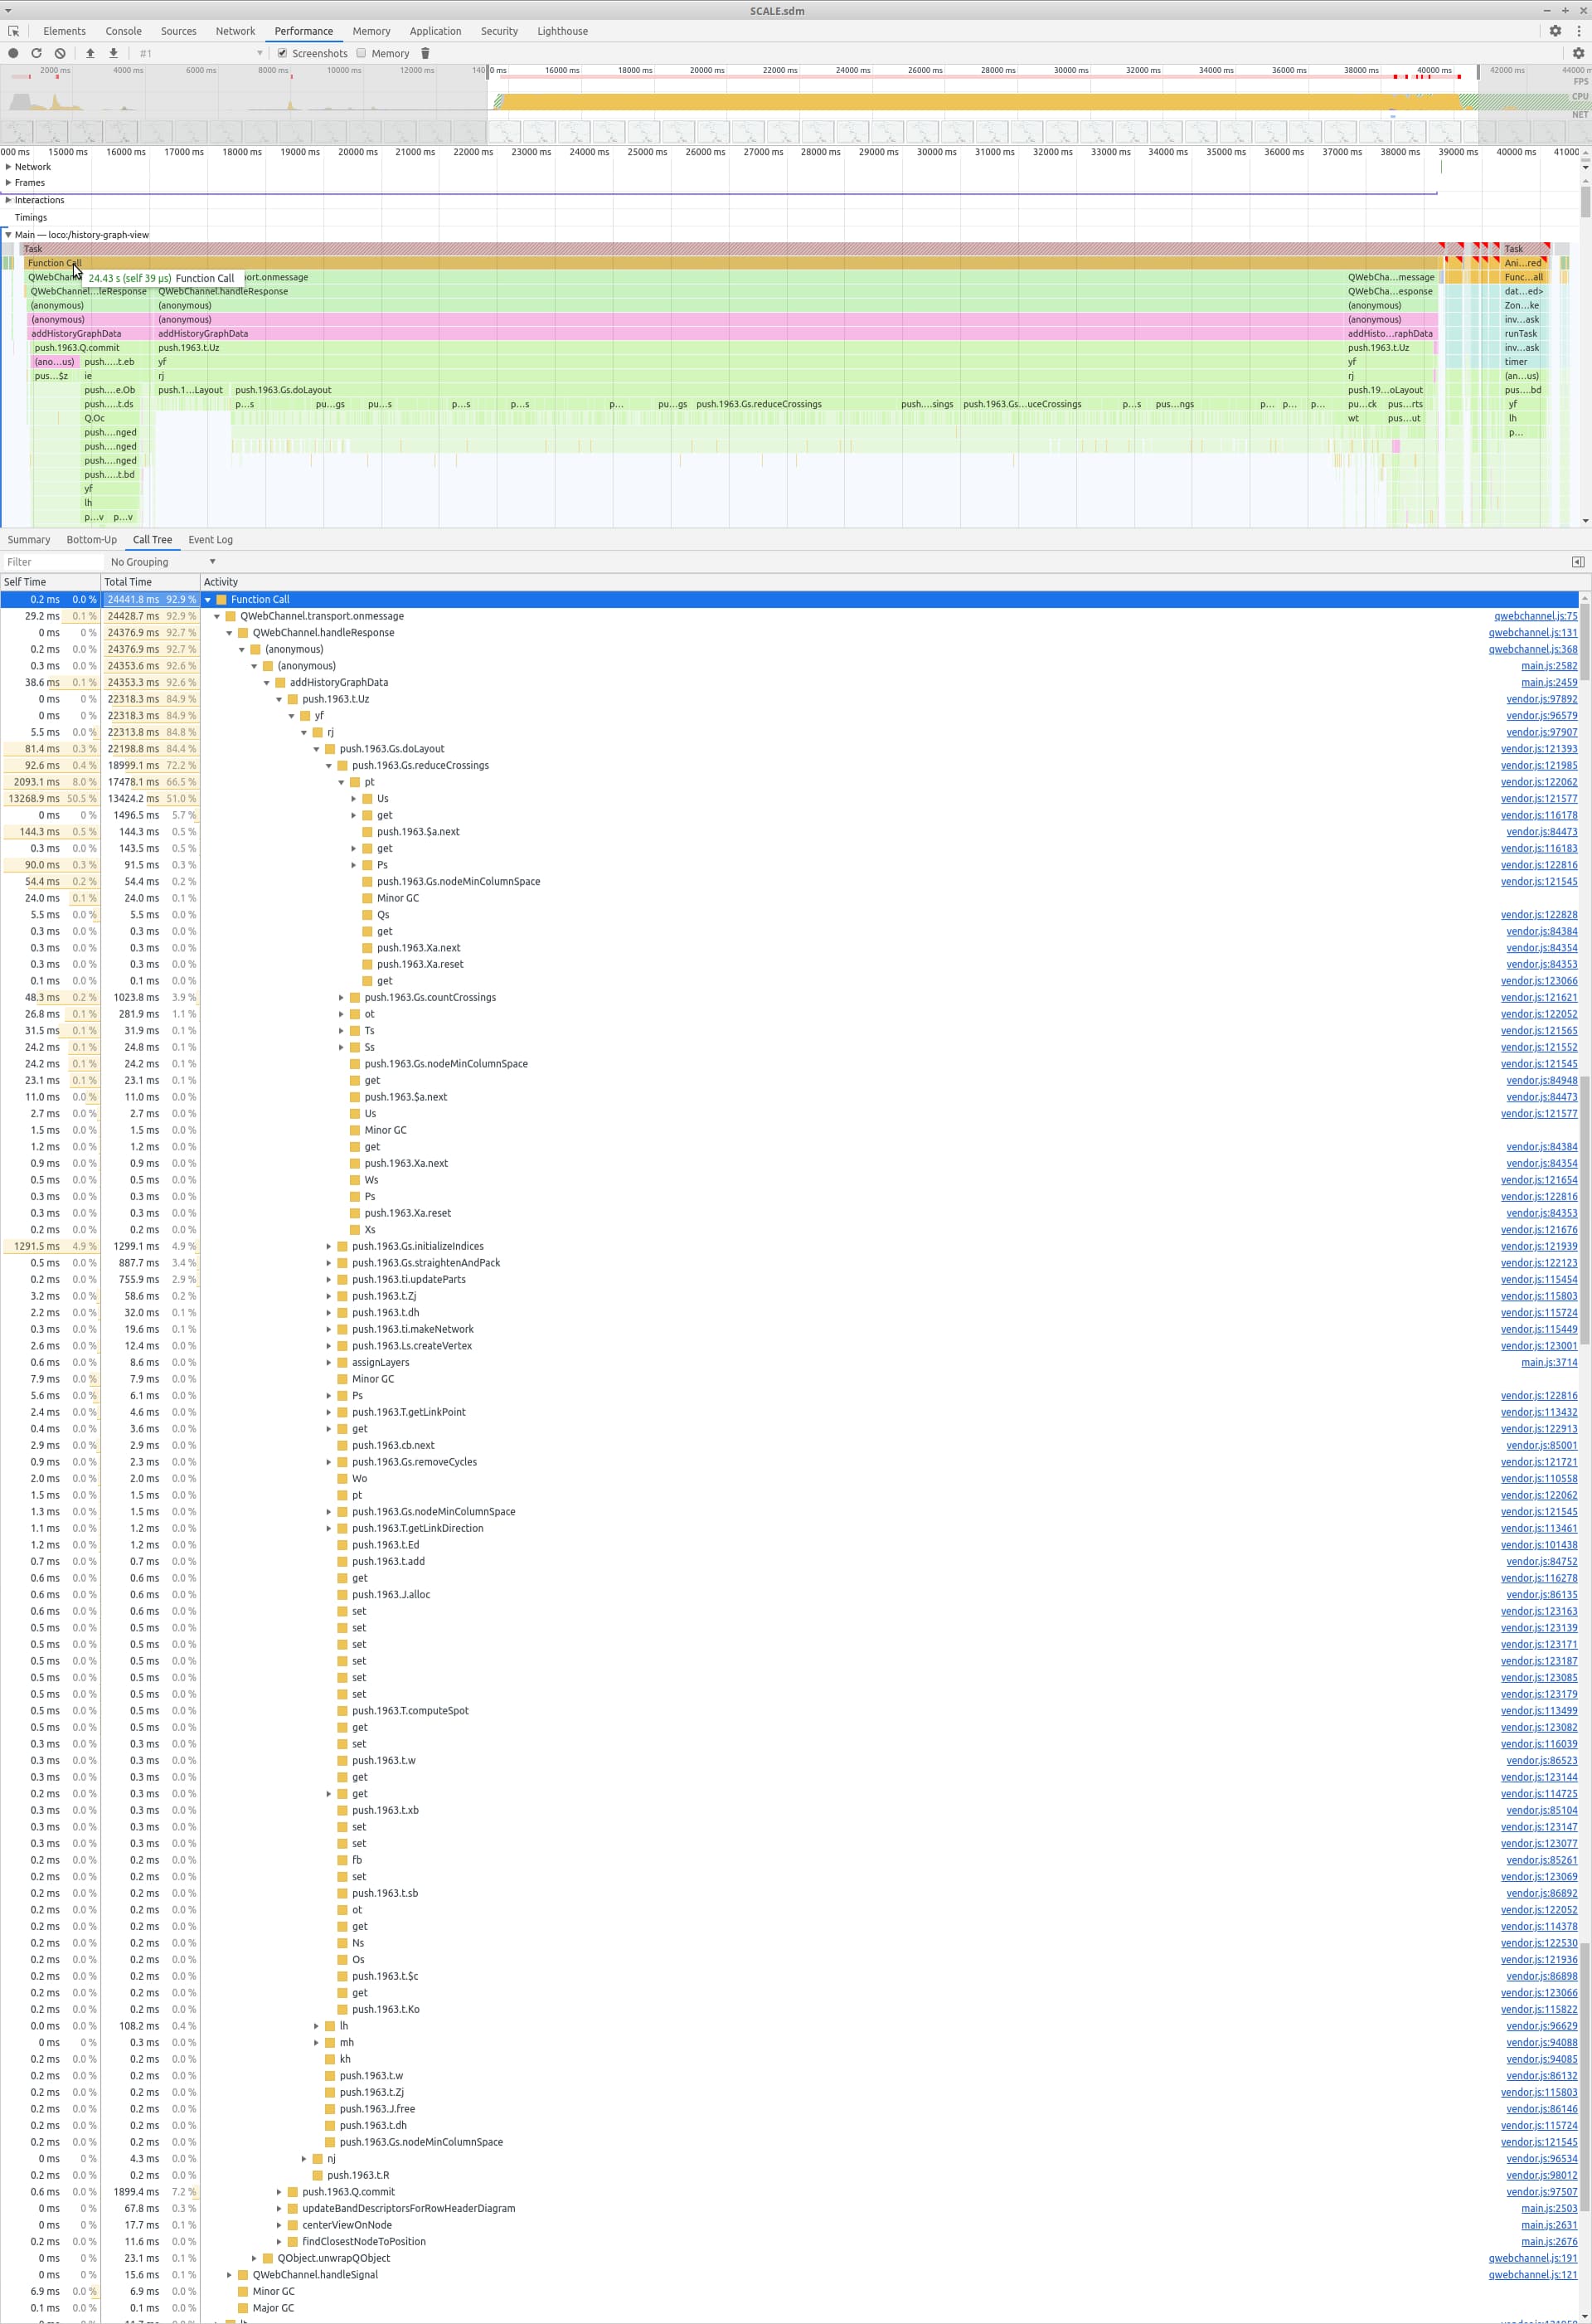
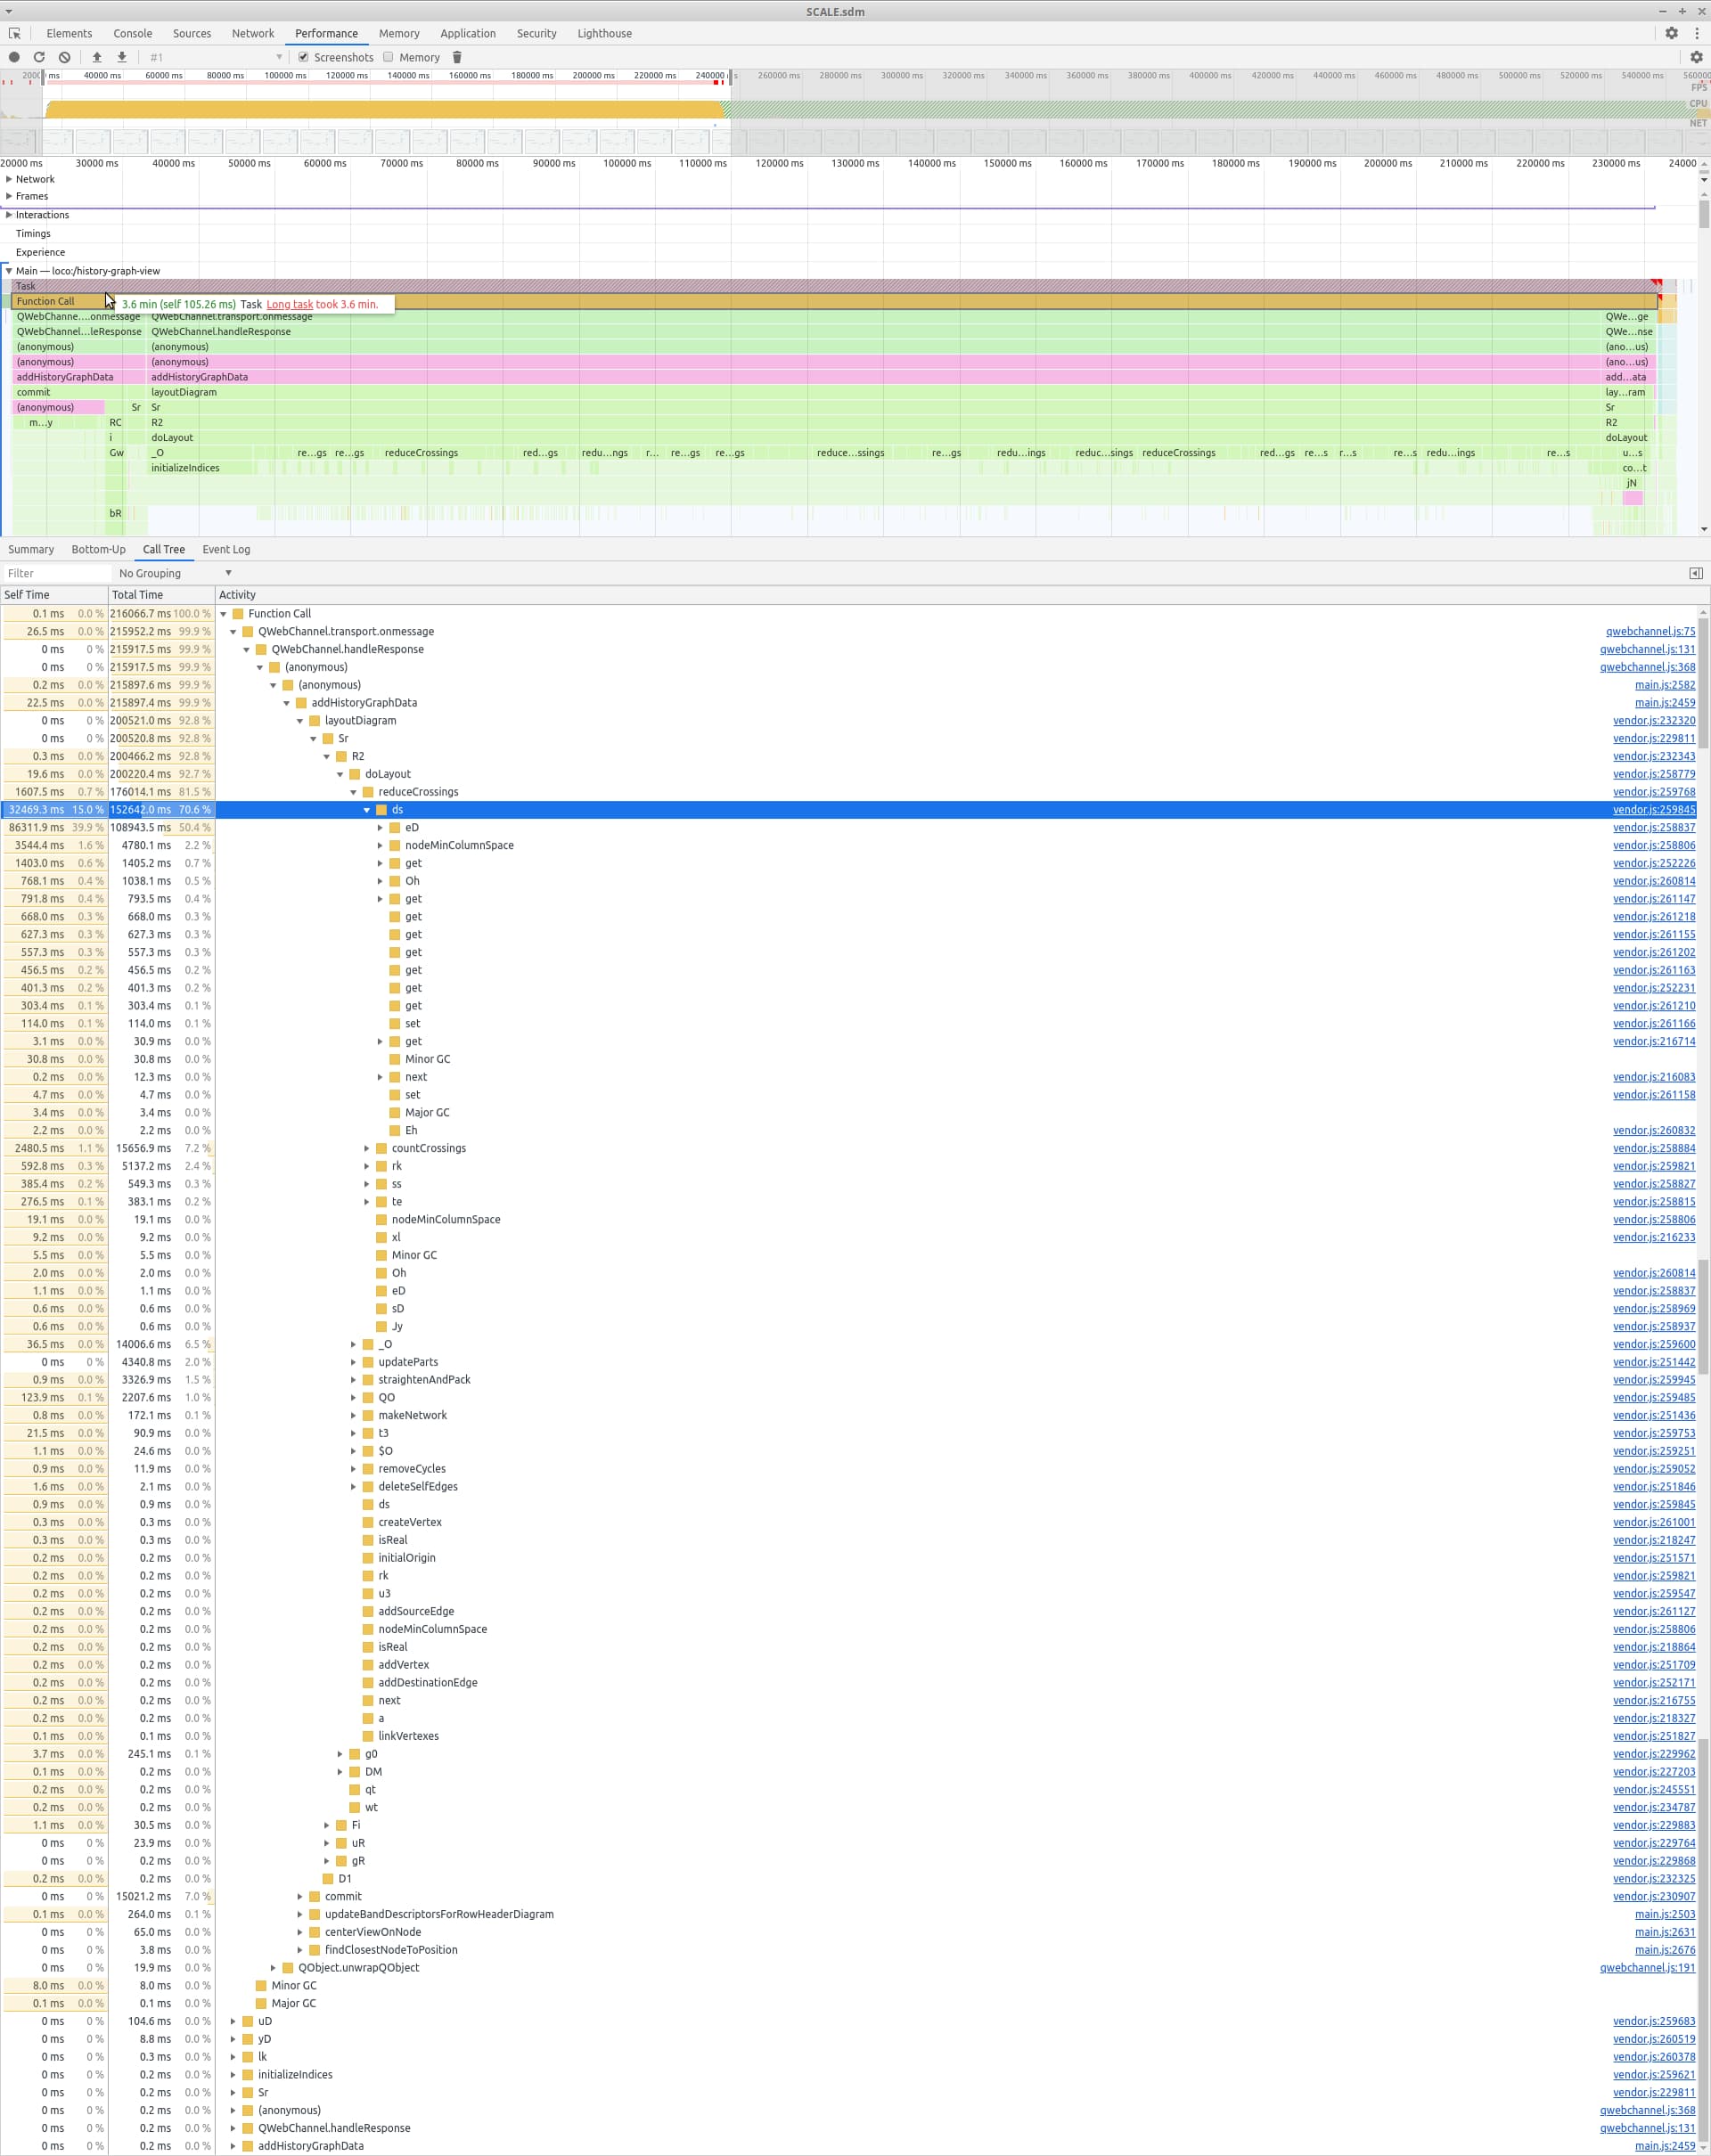
Using the following settings, I measured the performance of adding ~2.500 nodes to an existing graph with around 100 nodes.
layout: new BandedLayeredDigraphLayout(
  {
    alignOption: go.LayeredDigraphAlign.All,
    layeringOption: go.LayeredDigraphLayering.OptimalLinkLength,
    aggressiveOption: go.LayeredDigraphAggressive.Less,
    direction: this.horizontal ? 0 : 90,
    isOngoing: false,
    layerSpacing: 10,
    columnSpacing: 50,
    setsPortSpots: false, // spots are set on node instead
  }
),
In the screenshot below is the result of that analysis (unfortunately, I can not provide the profile data as is, since there is issue with the embedded chromium version of the Qt version we currently use in our client software, preventing saving of that data), showing the call tree with the calls that take the most percentage of overall running time expanded:
The relevant code for adding new data is the following:
addHistoryGraphData
  private addHistoryGraphData(historyGraphData: HistoryGraphData) {
    if (!this.historyGraphDiagram || !historyGraphData) {
      return;
    }
    const currentNodeCount: number = this.historyGraphDiagram.model.nodeDataArray.length;
    const nodeCountChanged: boolean = currentNodeCount !== historyGraphData.nodeData.length;
    const isInitialModelData: boolean = currentNodeCount === 0;

    let centeredNode: go.Node;
    let selectedNodes: go.Set<go.Part>;

    if (!isInitialModelData && nodeCountChanged) {
      if (this.extendedNodeUUID) {
        // After the history has been extended on a node, center the view on that node.
        centeredNode = this.historyGraphDiagram.findNodeForKey(this.extendedNodeUUID);
        this.extendedNodeUUID = null;
      } else {
        // Find the node, that is closest to the center of the viewport to restore the
        // scroll position. The search area around the viewport center extends beyond the
        // viewport bounds in order to increase the probability of finding a node.
        // This is only done, if the current node count is not zero and the node count is changed.
        // by the added data.
        const viewport = this.historyGraphDiagram.viewportBounds;
        const position = viewport.center;
        const width = viewport.width * 10;

        centeredNode = this.findClosestNodeToPosition(this.historyGraphDiagram, position, width);
      }
    }

    this.historyGraphDiagram.commit((d) => {
      const model = d.model as go.GraphLinksModel;
      model.mergeNodeDataArray(historyGraphData.nodeData);
      model.mergeLinkDataArray(historyGraphData.linkData);
    });
    this.historyGraphDiagram.layoutDiagram(true);

    // Update the row header diagram model.
    this.updateBandDescriptorsForRowHeaderDiagram();

    if (isInitialModelData) {
      centeredNode = this.historyGraphDiagram.findNodeForKey(historyGraphData.focusNodeUUID);
      selectedNodes = new go.Set<go.Part>([centeredNode]);
    }

    this.centerViewOnNode(centeredNode);
    this.selectNodes(selectedNodes);
  }
The class that is used for the layout is the following:
BandedLayeredDigraphLayout
import go from 'gojs';
import { BAND_IDENTIFIER, BandDescriptor } from '../templates/data-templates';

/**
 * A custom LayeredDigraphLayout that knows about "bands"
 * and that positions each node in its respective band.
 *
 * @category Layout Extension
 */

// NOTE: "Swimlane" layouts have the natural flow and growth of the layout go in the direction of the lanes.
// Nodes need to be annotated to indicate which lane they should be in.
// "Banded" layouts have the bands around layers of nodes that are laid out perpendicular to the natural flow.
// Nodes need to be annotated to indicate which band they should be in.

// Perform a LayeredDigraphLayout where each node is assigned to a "band", each of which may consist of multiple layers.
// LayeredDigraphLayout.commitLayers is overridden to modify the background Part whose key is "_BANDS".
// It is assumed that the _BANDS's data object's "descriptors" property will hold an Array of Objects, each describing a band.
// This Array determines the order of the bands, not the precedence order given by the nodes and links
// combined with the "band" property on each node data object identifying which band the node must be in.
// The node data "band" value should match one of the band descriptor's "text" property in the _BANDS descriptors.
// If the "band" property is not present or if it names a non-existent band, there will be a console warning,
// and the layout results might look odd.
export class BandedLayeredDigraphLayout extends go.LayeredDigraphLayout {
  private bandNames: go.Map<string, any> = new go.Map();

  // Helper function to return, if the layout direction is horizontal or not.
  private directionIsHorizontal(): boolean {
    return [0, 180].includes(this.direction);
  }

  private collectVertexesForBands(): go.Map<string, go.Set<go.LayeredDigraphVertex>> {
    const bandVertexes = new go.Map<string, go.Set<go.LayeredDigraphVertex>>();

    const vertexIterator = this.network.vertexes.iterator;
    while (vertexIterator.next()) {
      const vertex: go.LayeredDigraphVertex = vertexIterator.value as go.LayeredDigraphVertex;

      if (vertex.node === null || vertex.node.data === null) {
        continue;
      }

      const band = vertex.node.data.bandName;
      if (!this.bandNames.get(band)) {
        console.log(
          'BandedLayeredDigraphLayout: unknown band name on node data: '
          + band + ' on node of key: ' + vertex.node.key
        );
      }

      if (!bandVertexes.get(band)) {
        bandVertexes.set(band, new go.Set<go.LayeredDigraphVertex>());
      }

      bandVertexes.get(band).add(vertex);
    }

    return bandVertexes;
  }

  private walkAllWithinBand(name: string, vertex: go.LayeredDigraphVertex, depths: go.Map<go.LayeredDigraphVertex, number>): number {
    if (depths.has(vertex)) {
      return depths.get(vertex);
    }

    let depth = 0;
    vertex.sourceVertexes.each(sourceVertex => {
      if (!sourceVertex.node || !sourceVertex.node.data || sourceVertex.node.data.bandName !== name) {
        // ignore vertexes of different band
        return;
      }

      depth = Math.max(depth, this.walkAllWithinBand(name, sourceVertex as go.LayeredDigraphVertex, depths));
    });

    depths.set(vertex, depth + 1);

    return depth + 1;
  }

  // eslint-disable-next-line max-len
  private determineBandDepthsAndLayerCount(bandVertexes: go.Map<string, go.Set<go.LayeredDigraphVertex>>): [go.Map<go.LayeredDigraphVertex, number>, number] {
    // for each band, determine how many layers are needed by looking for longest
    // chain of vertexes with that band name
    let totalLayerCount = 0;
    const allBandDepths = new go.Map<go.LayeredDigraphVertex, number>();  // map vertex to relative depth within band

    bandVertexes.each(bandVertex => {
      const name: string = bandVertex.key;
      const vertexes: go.Set<go.LayeredDigraphVertex> = bandVertex.value;
      const vertexDepthPairs: go.Map<go.LayeredDigraphVertex, number> = new go.Map();  // map vertex to relative depth within band NAME
      vertexes.each(vertex => this.walkAllWithinBand(name, vertex, vertexDepthPairs));

      let max = 0;
      vertexDepthPairs.each(vertexDepthPair => {
        max = Math.max(max, vertexDepthPair.value);
        allBandDepths.set(vertexDepthPair.key, vertexDepthPair.value);
      });

      const bandDescriptor = this.bandNames.get(name);
      if (bandDescriptor) {
        bandDescriptor.depth = max;
      }
      totalLayerCount += Math.max(max, 1);  // assume a band requires a layer, even if there are no nodes in it
    });

    return [allBandDepths, totalLayerCount];
  }

  private assignLayerToVertexes(allBandDepths: go.Map<go.LayeredDigraphVertex, number>, totalLayerCount: number) {
    // assign vertex.layer for each vertex
    const vertexIterator = this.network.vertexes.iterator;
    while (vertexIterator.next()) {
      const vertex = vertexIterator.value as go.LayeredDigraphVertex;
      if (vertex.node === null || vertex.node.data === null) {
        continue;
      }

      const name = vertex.node.data.bandName;
      const bandDescriptor = this.bandNames.get(name);
      const depth = allBandDepths.get(vertex);
      if (bandDescriptor && typeof depth === 'number') {
        // reverse the layer number -- last layer is number zero
        vertex.layer = totalLayerCount - (bandDescriptor.start + depth);
      }
    }
  }

  protected assignLayers() {
    // map band name to band descriptor holding name and layer ranges
    this.bandNames = new go.Map<string, any>();

    const bands = this.diagram.findPartForKey(BAND_IDENTIFIER);
    if (!bands) {
      return;
    }

    const bandDescriptors: Array<BandDescriptor> = bands.data.descriptors;
    if (!Array.isArray(bandDescriptors)) {
      return;
    }

    for (const bandDescriptor of bandDescriptors) {
      this.bandNames.set(bandDescriptor.text, bandDescriptor);
    }

    // collect all vertexes for each band
    const bandVertexes = this.collectVertexesForBands();
    // determine depth for each band and total number of needed layers
    const [allBandDepths, totalLayerCount] = this.determineBandDepthsAndLayerCount(bandVertexes);

    // iterate over the bands and assign layer number ranges
    let layer = 0;
    for (const bandDescriptor of bandDescriptors) {
      bandDescriptor.start = layer;
      layer += bandDescriptor.depth;
    }

    this.assignLayerToVertexes(allBandDepths, totalLayerCount);
  }

  protected commitLayers(layerRects: Array<go.Rect>, offset: go.Point) {
    // update the background object holding the visual "bands"
    const bands = this.diagram.findPartForKey(BAND_IDENTIFIER);
    if (bands) {
      const model = this.diagram.model;
      bands.location = this.arrangementOrigin.copy().add(offset);

      // set the bounds of each band via data binding of the "bounds" property
      const bandDescriptors = bands.data.descriptors;
      let j = 0;
      for (let i = 0; i < bandDescriptors.length && j < layerRects.length; i++) {
        const bandDescriptor = bandDescriptors[i];
        if (!bandDescriptor) {
          continue;
        }

        let k = j;
        let thickness = 0;
        for (; k < Math.min(j+bandDescriptor.depth, layerRects.length); k++) {
          if (this.directionIsHorizontal()) {
            thickness += layerRects[k].width;
          } else {
            thickness += layerRects[k].height;
          }
        }

        const r = layerRects[j].copy();  // first rect gives shared bounds info
        if (this.directionIsHorizontal()) {
            if (this.direction === 180) {
              r.x = layerRects[k-1].x;
            }
            r.width = thickness;
          } else {
            if (this.direction === 270) {
              r.y = layerRects[k-1].y;
            }
            r.height = thickness;
        }

        model.set(bandDescriptor, 'bounds', r); // an actual Rect, not stringified
        j = k;  // next layer/band
      }

      // Set the bounds for each band, that has no nodes.
      const lastBounds = layerRects[layerRects.length - 1];
      for (const bandDescriptor of bandDescriptors) {
        if (bandDescriptor.depth > 0) {
          continue;
        }

        const r = lastBounds.copy();
        if (this.directionIsHorizontal()) {
          r.width = 0;
        } else {
          r.height = 0;
        }

        model.set(bandDescriptor, 'bounds', r); // an actual Rect, not stringified
      }

    }
    this.bandNames = null; // cleanup
  }
}
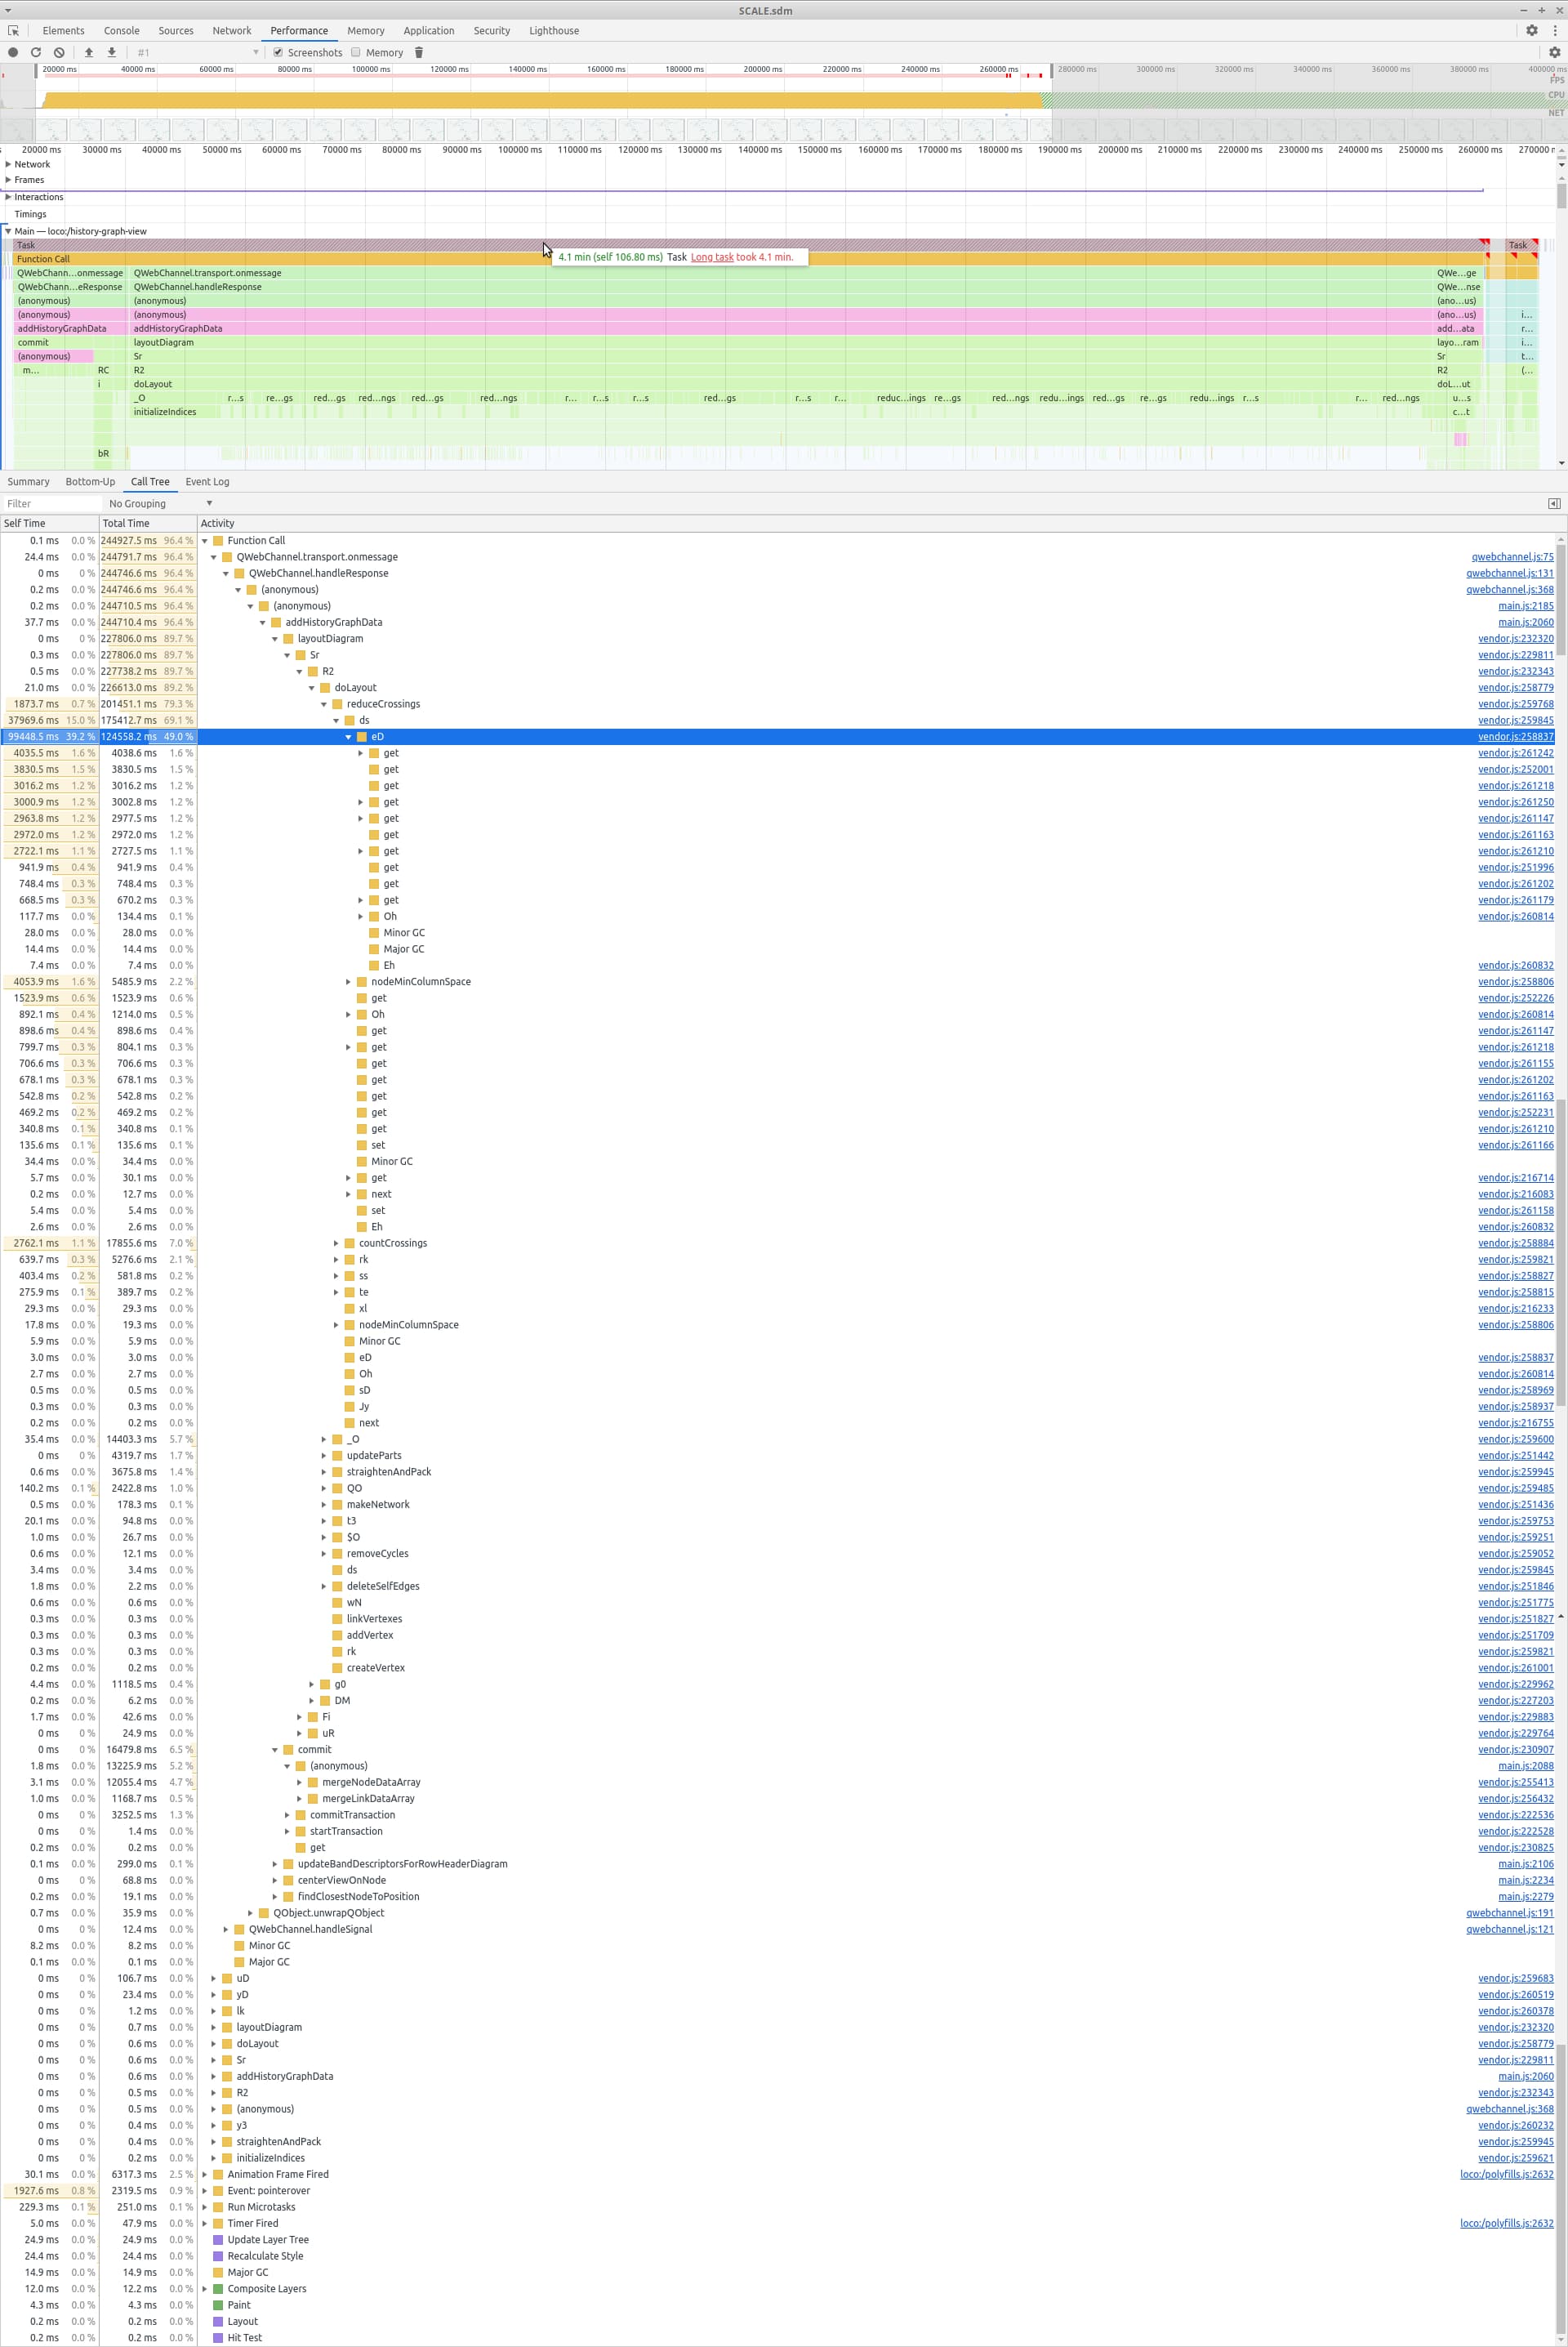
Concerning the second issue of zooming/panning, I created the following profile, which suggests that a lot of time goes into updating the model. Please note, that this is an extreme case concerning the runtime. There are also cases where this takes half a second, but I wanted to show a case where every performed step is clearly visible.
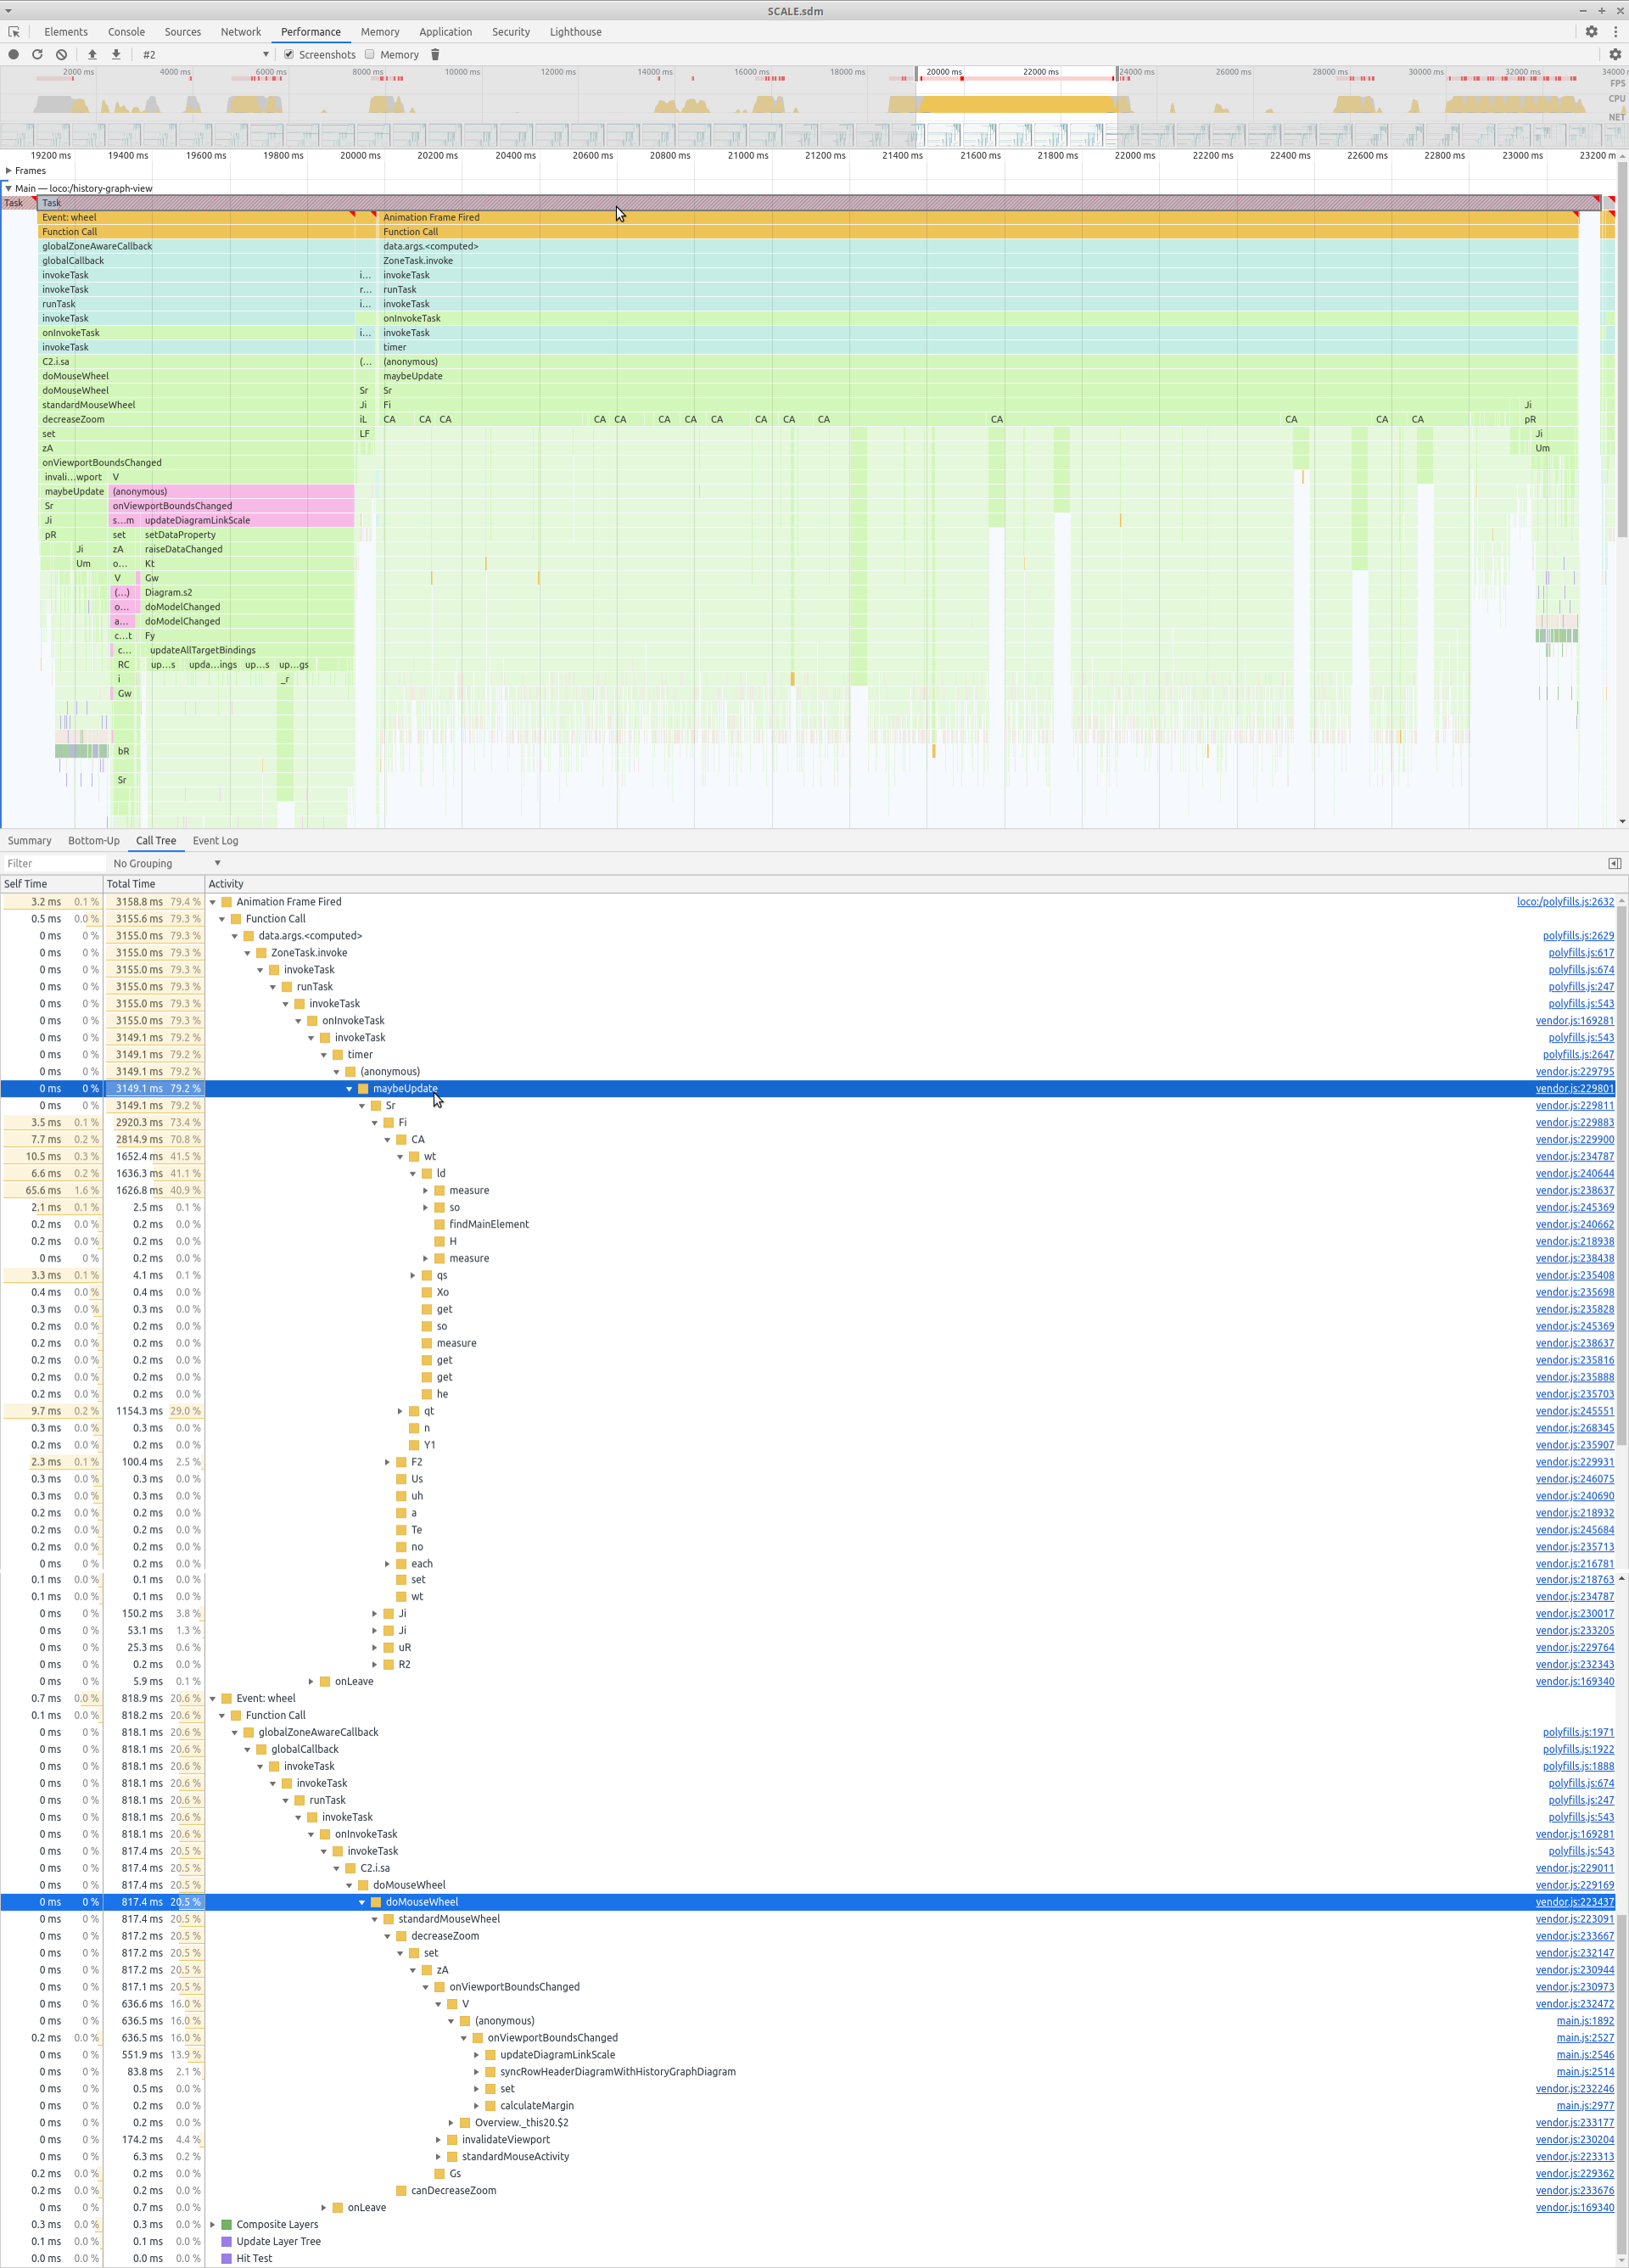
The callbacks for the viewport change that are visible in the profile which I implemented are the following:
onViewportBoundsChanged
  private onViewportBoundsChanged(event: go.DiagramEvent) {
    this.syncRowHeaderDiagramWithHistoryGraphDiagram();

    const oldScale: number = event.subject.scale;
    const newScale: number = this.historyGraphDiagram.scale;
    if (oldScale.toFixed(1) !== newScale.toFixed(1)) {
      // Calculate the padding dependent on the scale. This way, the given target width is
      // always translated into the correct document width.
      // The fixed target width is the width of the filter panel. See the corresponding style sheet.
      // Might be better to get that value from the filter panel component.
      // However, this needs further changes.
      this.historyGraphDiagram.padding = HistoryGraphComponent.calculateMargin(
        500, newScale,
      );

      // Update the link scale when the diagram layout has changed, e.g. when new links were added,
      // so that those links get the diagram link scale.
      this.updateDiagramLinkScale(newScale);
    }
  }
syncRowHeaderDiagramWithHistoryGraphDiagram
// Ensures, that row header diagram and history graph diagram have the same vertical position and scale,
// after the viewport bounds of the history graph diagram have changed.
private syncRowHeaderDiagramWithHistoryGraphDiagram() {
if (this.syncingViewPorts) {
return;
}
this.syncingViewPorts = true;
this.rowHeaderDiagram.scale = this.historyGraphDiagram.scale;
this.rowHeaderDiagram.position = new go.Point(0, this.historyGraphDiagram.position.y + SYNC_DIAGRAMS_POSITION_Y_OFFSET);
this.rowHeaderDiagram.minScale = this.historyGraphDiagram.minScale;
this.rowHeaderDiagram.maxScale = this.historyGraphDiagram.maxScale;
this.syncingViewPorts = false;
}
updateDiagramLinkScale
``
// Update the scale for drawing the links with the given diagram scale.
private updateDiagramLinkScale(scale: number): void {
if (scale > 1) {
// Skip update, since the maximum scale for the links should be 1 in order
// to prevent links getting too wide when zooming closer into the diagram.
return;
}
const model = this.historyGraphDiagram.model as go.GraphLinksModel;
// Update the model property in order to notify the link template that data
// has changed and redrawing is necessary. See also
// https://forum.nwoods.com/t/problem-with-refresh-link-lines-color-and-dashed/5740.
model.setDataProperty(model.modelData, 'diagramLinkScale', scale);
}
// Ensures, that row header diagram and history graph diagram have the same vertical position and scale,
// after the viewport bounds of the row header diagram have changed.
private syncHistoryGraphDiagramWithRowHeaderDiagram() {
if (this.syncingViewPorts) {
return;
}
this.syncingViewPorts = true;
this.historyGraphDiagram.scale = this.rowHeaderDiagram.scale;
this.historyGraphDiagram.position = new go.Point(
  this.historyGraphDiagram.viewportBounds.x, this.rowHeaderDiagram.position.y - SYNC_DIAGRAMS_POSITION_Y_OFFSET
);
this.syncingViewPorts = false;
}
Thanks in advance for your help. Please let me know if you need additional information from me in order to resolve this issue.
My best,
Manuel