Scroll page/HTMLElement instead of diagram when using touch gesture

Hello,

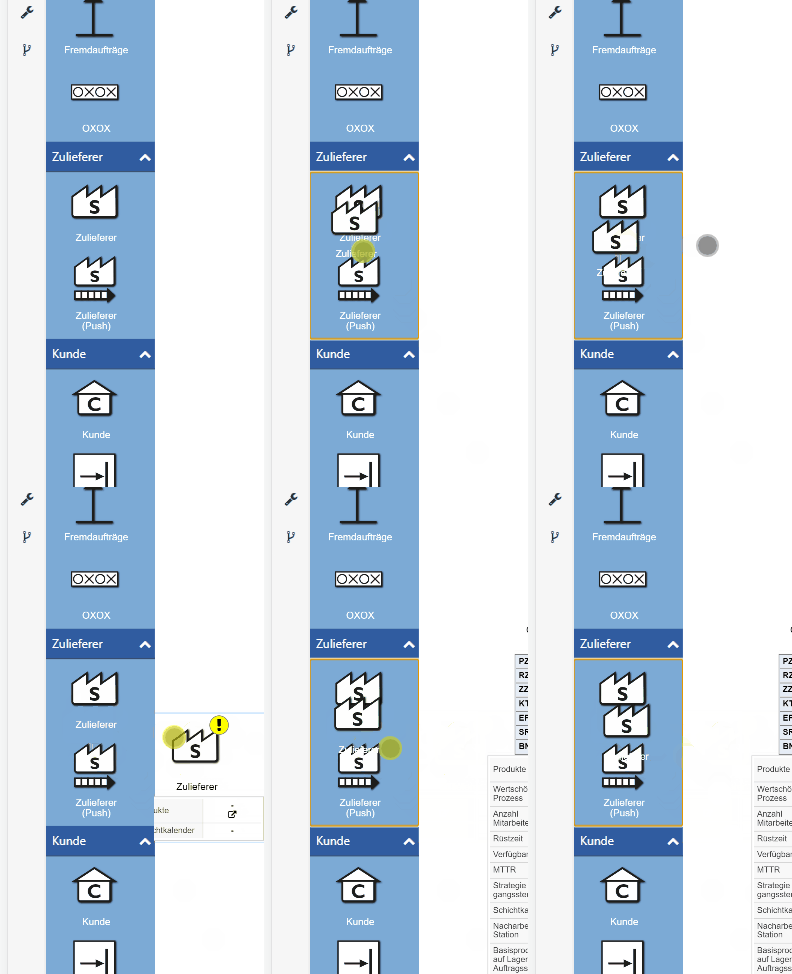
we have a “toolbox” consisting of multiple palettes (categorized into logical groups):

Now I’d like to vertically scroll through the various palettes (i.e. scroll the container HTML Element, not within a single palette)

This works fine when using a mouse wheel, but it doesn’t work using touch gestures.
scroll

The dragSelectingTool and verticalScrolling is already disabled.

How could I scroll the complete HTML Element with a touch gesture?

Maybe set PanningTool.bubbles to true? Although I think you had better not have set Diagram.allowScroll to false. I haven’t tried this.

Setting PanningTool.bubbles to true doesn’t seem to help.
I have created an online example: https://codepen.io/dominic-simplan/pen/abRdMZz

Yes, the default behavior for scroll-wheel events is to scroll the diagram as far as it can go, and then let the event bubble, which normally causes the page to scroll.

I don’t think there’s an equivalent behavior for panning using the mouse or finger. We’ll investigate this.

There is no “scroll to the end of the diagram, then scroll the page” equivalent for touch-panning, it would be difficult to stop.

Do you want it to both pan, and if it cannot pan, attempt to bubble the event? Or do you solely want the panning events in question to bubble?

It turns out we are actually bubbling that event, but the browser seems to stop the page from scrolling regardless, possibly because we do not bubble the corresponding prior pointerdown. But possibly there’s some other reason. We’ll keep investigating.

Even if I bubble all events, it still won’t scroll the page, and the reason is that we apply the CSS touch-action: none to the Diagram Canvas.

You could try to turn this off in the y-direction, which would still allow you to drag nodes in the x-direction. You could add:

// instead of the default "none"
myDiagram.div.firstChild.style.touchAction = 'pan-y';
myDiagram.toolManager.panningTool.isEnabled= false;
myDiagram.toolManager.dragSelectingTool.isEnabled= false;

That will work, but it’s pretty brittle. It may be that there’s a better way to typically stop page-panning, but we’ll have to experiment for a while, and I can’t promise anything.

Thank you for the investigation!

For my use case it would be okay if there is no panning. There is no currently need to pan the palette(s).
So basically either the user can drag&drop a node into the diagram, or he can scroll the whole HTMLElement containing the palettes.

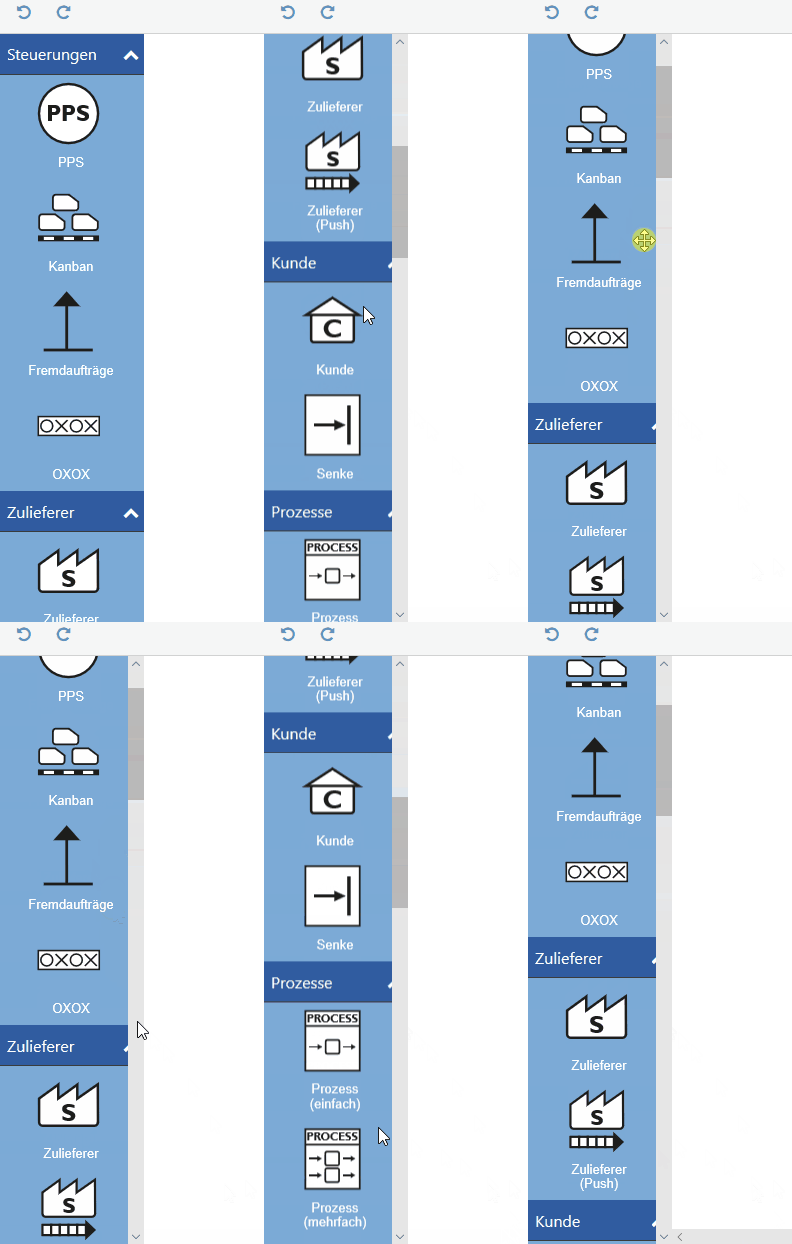
I tried your workaround with the pan-y but its behaving a bit strange (I can drag it a few pixels vertically and the node still remains there even after I release the touch):
scroll2

Yeah, that’s what I meant by brittle. It is up to the browser to determine if its an x or y pan, so it decides to forward (or not) the events in the middle of touch-moving. It’s not a great solution.

But you can’t simply turn on touch-actions completely, because then the GoJS canvas never receives the events at all, and because it would try to pan left-right as you were trying to drag and drop.

A better workaround for now would be making one large Palette, I think, if that’s an option. I’m still not yet sure what we can do better here.

Okay, so how could I implement this in one large palette?
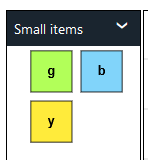
I guess I could make a group (similar to here: GoJS SubGraphs -- Northwoods Software)
How could I make the group header to have 100% width of the palette?

Or is there a better approch to using groups? Is there anything else I need to consider?

Basically each groups needs to be able to be extended/collapsed.

<!DOCTYPE html>
<html>
<head>
  <title>Minimal GoJS Editor</title>
  <!-- Copyright 1998-2023 by Northwoods Software Corporation. -->
</head>
<body>
  <div style="width: 100%; display: flex; justify-content: space-between">
    <div style="display: flex; flex-direction: column; margin: 0 2px 0 0">
      <div id="myPaletteDiv" style="flex-grow: 1; width: 100px; background-color: floralwhite; border: solid 1px black"></div>
      <div id="myOverviewDiv" style="margin: 2px 0 0 0; width: 100px; height: 100px; background-color: whitesmoke; border: solid 1px black"></div>
    </div>
    <div id="myDiagramDiv" style="flex-grow: 1; height: 400px; border: solid 1px black"></div>
  </div>
  <div>
    <button id="myLoadButton">Load</button>
    <button id="mySaveButton">Save</button>
  </div>
  <textarea id="mySavedModel" style="width:100%;height:200px">
{ "class": "go.GraphLinksModel",
  "nodeDataArray": [
{"key":1, "text":"hello", "color":"green", "location":"0 0"},
{"key":2, "text":"world", "color":"red", "location":"70 0"}
  ],
  "linkDataArray": [
{"from":1, "to":2}
  ]}
  </textarea>

  <script src="https://unpkg.com/gojs"></script>
  <script id="code">
const $ = go.GraphObject.make;

// initialize main Diagram
const myDiagram =
  $(go.Diagram, "myDiagramDiv",
    {
      "undoManager.isEnabled": true
    });

myDiagram.nodeTemplate =
  $(go.Node, "Auto",
    { locationSpot: go.Spot.Center },
    new go.Binding("location", "location", go.Point.parse).makeTwoWay(go.Point.stringify),
    $(go.Shape,
      {
        fill: "white", stroke: "gray", strokeWidth: 2,
        portId: "", fromLinkable: true, toLinkable: true,
        fromLinkableDuplicates: true, toLinkableDuplicates: true,
        fromLinkableSelfNode: true, toLinkableSelfNode: true
      },
      new go.Binding("stroke", "color")),
    $(go.TextBlock,
      {
        margin: new go.Margin(5, 5, 3, 5), font: "10pt sans-serif",
        minSize: new go.Size(16, 16), maxSize: new go.Size(120, NaN),
        editable: true
      },
      new go.Binding("text").makeTwoWay())
  );

// initialize Palette
myPalette =
  $(go.Palette, "myPaletteDiv",
    {
      padding: 0,
      layout: $(go.GridLayout,
        {
          wrappingColumn: 1,
          alignment: go.GridLayout.Position,
          cellSize: new go.Size(1, 1),
          spacing: new go.Size(0, 0)
        }),
      hasHorizontalScrollbar: false,
      hasVerticalScrollbar: false,
      isReadOnly: false,
      allowDelete: false,
      allowInsert: false,
      allowMove: false,
      nodeTemplate:
        $(go.Node, "Vertical",
          { locationSpot: go.Spot.Center },
          $(go.Shape, { width: 30, height: 30, fill: "white" },
            new go.Binding("fill", "color")),
          $(go.TextBlock, 
            new go.Binding("text"))
        ),
      groupTemplate:
        $(go.Group, "Vertical",
          { selectable: false, copyable: false },
          { layout: $(go.GridLayout, { wrappingColumn: 1 }) },
          $(go.Panel, "Auto",
            { name: "HEADER", width: 100, height: 30 },
            $(go.Shape, { fill: "slateblue", strokeWidth: 0 }),
            $(go.TextBlock, { stroke: "white" },
              new go.Binding("text")),
            $("SubGraphExpanderButton", { alignment: go.Spot.Right })
          ),
          $(go.Placeholder, { padding: new go.Margin(10, 0, 0, 0) })
        ),
      "ViewportBoundsChanged": e => {
        if (e.subject.bounds.width !== e.diagram.viewportBounds.width) {
          e.diagram.findTopLevelGroups().each(g => {
            const head = g.findObject("HEADER");
            head.width = e.diagram.viewportBounds.width;
          });
        }
      },
      model: new go.GraphLinksModel([
        { key: 1, isGroup: true, text: "Group 1" },
        { group: 1, text: "red node", color: "red" },
        { group: 1, text: "green node", color: "green" },
        { group: 1, text: "blue node", color: "blue" },
        { group: 1, text: "orange node", color: "orange" },
        { key: 2, isGroup: true, text: "Group 2" },
        { group: 2, text: "pink", color: "pink" },
        { group: 2, text: "lightgreen", color: "lightgreen" },
        { group: 2, text: "lightblue", color: "lightblue" },
        { group: 2, text: "gold", color: "gold" }
      ])
    });

// initialize Overview
myOverview =
  $(go.Overview, "myOverviewDiv",
    {
      observed: myDiagram,
      contentAlignment: go.Spot.Center
    });

// save a model to and load a model from Json text, displayed below the Diagram
function save() {
  var str = myDiagram.model.toJson();
  document.getElementById("mySavedModel").value = str;
}
document.getElementById("mySaveButton").addEventListener("click", save);

function load() {
  var str = document.getElementById("mySavedModel").value;
  myDiagram.model = go.Model.fromJson(str);
}
document.getElementById("myLoadButton").addEventListener("click", load);

load();
  </script>
</body>
</html>
Thank you walter, that looks great!
One follow up question. I am trying to add the SubGraphExpanderButton, but it is not working. What am I doing wrong?

<!DOCTYPE html>
<html>
<head>
  <title>Minimal GoJS Editor</title>
  <!-- Copyright 1998-2023 by Northwoods Software Corporation. -->
</head>
<body>
  <div style="width: 100%; display: flex; justify-content: space-between">
    <div style="display: flex; flex-direction: column; margin: 0 2px 0 0">
      <div id="myPaletteDiv" style="flex-grow: 1; width: 100px; background-color: floralwhite; border: solid 1px black"></div>
      <div id="myOverviewDiv" style="margin: 2px 0 0 0; width: 100px; height: 100px; background-color: whitesmoke; border: solid 1px black"></div>
    </div>
    <div id="myDiagramDiv" style="flex-grow: 1; height: 400px; border: solid 1px black"></div>
  </div>
  <div>
    <button id="myLoadButton">Load</button>
    <button id="mySaveButton">Save</button>
  </div>
  <textarea id="mySavedModel" style="width:100%;height:200px">
{ "class": "go.GraphLinksModel",
  "nodeDataArray": [
{"key":1, "text":"hello", "color":"green", "location":"0 0"},
{"key":2, "text":"world", "color":"red", "location":"70 0"}
  ],
  "linkDataArray": [
{"from":1, "to":2}
  ]}
  </textarea>

  <script src="https://unpkg.com/gojs"></script>
  <script id="code">
const $ = go.GraphObject.make;

// initialize main Diagram
const myDiagram =
  $(go.Diagram, "myDiagramDiv",
    {
      "undoManager.isEnabled": true
    });

myDiagram.nodeTemplate =
  $(go.Node, "Auto",
    { locationSpot: go.Spot.Center },
    new go.Binding("location", "location", go.Point.parse).makeTwoWay(go.Point.stringify),
    $(go.Shape,
      {
        fill: "white", stroke: "gray", strokeWidth: 2,
        portId: "", fromLinkable: true, toLinkable: true,
        fromLinkableDuplicates: true, toLinkableDuplicates: true,
        fromLinkableSelfNode: true, toLinkableSelfNode: true
      },
      new go.Binding("stroke", "color")),
    $(go.TextBlock,
      {
        margin: new go.Margin(5, 5, 3, 5), font: "10pt sans-serif",
        minSize: new go.Size(16, 16), maxSize: new go.Size(120, NaN),
        editable: true
      },
      new go.Binding("text").makeTwoWay())
  );

// initialize Palette
myPalette =
  $(go.Palette, "myPaletteDiv",
    {
      padding: 0,
      layout: $(go.GridLayout, { wrappingColumn: 1, alignment: go.GridLayout.Position }),
      hasHorizontalScrollbar: false,
      hasVerticalScrollbar: false,
      nodeTemplate:
        $(go.Node, "Vertical",
          { locationSpot: go.Spot.Center },
          $(go.Shape, { width: 30, height: 30, fill: "white" },
            new go.Binding("fill", "color")),
          $(go.TextBlock, 
            new go.Binding("text"))
        ),
      groupTemplate:
        $(go.Group, "Vertical",
          { selectionAdorned: false },
          { layout: $(go.GridLayout, { wrappingColumn: 1 }) },
          $(go.Panel, "Auto",
            { name: "HEADER", width: 100, height: 30 },
            $(go.Shape, { fill: "slateblue", strokeWidth: 0 }),
			$(go.Panel, "Horizontal", {}, 
				$("SubGraphExpanderButton", {}),
				$(go.TextBlock, { stroke: "white" }, new go.Binding("text"))
			),
          ),
          $(go.Placeholder, { padding: new go.Margin(10, 0, 0, 0) })
        ),
      "ViewportBoundsChanged": e => {
        if (e.subject.bounds.width !== e.diagram.viewportBounds.width) {
          e.diagram.findTopLevelGroups().each(g => {
            const head = g.findObject("HEADER");
            head.width = e.diagram.viewportBounds.width;
          });
        }
      },
      model: new go.GraphLinksModel([
        { key: 1, isGroup: true, text: "Group 1" },
        { group: 1, text: "red node", color: "red" },
        { group: 1, text: "orange node", color: "orange" },
        { key: 2, isGroup: true, text: "Group 2" },
        { group: 2, text: "pink", color: "pink" },
        { group: 2, text: "lightgreen", color: "lightgreen" },
        { group: 2, text: "lightblue", color: "lightblue" },
        { group: 2, text: "gold", color: "gold" }
      ])
    });

// initialize Overview
myOverview =
  $(go.Overview, "myOverviewDiv",
    {
      observed: myDiagram,
      contentAlignment: go.Spot.Center
    });

// save a model to and load a model from Json text, displayed below the Diagram
function save() {
  var str = myDiagram.model.toJson();
  document.getElementById("mySavedModel").value = str;
}
document.getElementById("mySaveButton").addEventListener("click", save);

function load() {
  var str = document.getElementById("mySavedModel").value;
  myDiagram.model = go.Model.fromJson(str);
}
document.getElementById("myLoadButton").addEventListener("click", load);

load();
  </script>
</body>
</html>
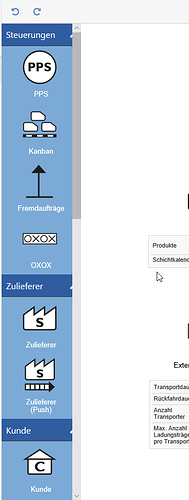
Palettes are read-only by default, so you need to turn that off and add whatever properties you need to avoid the user from doing things that you don’t want them to do.

I updated the code – copy it again.

Thank you! Didn’t consider the readOnly property…
Now I am almost there. One more question:
Is it possible to rearrange the nodes in the group so that they are shown in multiple columns when zooming out (just as in this example: Planogram)?
grafik

Currently they are always in a single column, even when I remove or change the wrappingColumn property.

Sorry to push this but any hint how I can achieve this?

Your Group.layout is a GridLayout, yes?

Instead of specifying GridLayout.wrappingColumn, try setting GridLayout.wrappingWidth. Then in a “ViewportBoundsChanged” DiagramEvent listener, whenever the e.subject.bounds.width is different from the e.diagram.viewportBounds.width, update all of the Group.layouts wrappingWidth appropriately.

Thank you, that worked for our toolbox if it is displayed vertically.
However we also have the option to display the toolbox horizontally:

I guess could do some crazy calculation using the group.memberParts and the e.diagram.viewportBounds.height to determine the ideal wrappingColumn value, however it seems a bit fragile.

Any better suggestion? Is there anything like a RotatedGridLayout?

What happens when you set GridLayout.wrappingWidth to Infinity?

You will also need to rotate the header text.

Changing wrappingWidth didn’t change the behavior.
I think we had a similar discussion before: Horizontal palette with auto-wrap and vertical scrollbar

For now we’ll go with only one row in a vertical palette. Maybe we’ll reevaluate this later.

Thanks for your help, we have successfully refactored our toolbox into a single palette! (Even though it was quite tricky on the multiple browsers with different scrollbar behavior.)