Use graduatedPointForValue to position ticks

Hi,

After this discussion here about the graduatedSkip method and some performance tests I run lately, I decided to position the min and max tick manually and use the GCD as graduatedTickUnit to get better performance.

Now, I am struggling to get the point of these two values using graduatedPointForValue and I guess there is something wrong with my template. I can’t identify what’s the problem yet.

image

It seems after resizing the block, the ticks are displayed in the good spot !

image

Here is a codesandbox.

Ignore that I am not skipping the min and the max now I want just to see if the position match first.

I’m not sure how to fix it. Is there anything I am doing wrong in the template ?

I suspect two points I could enhance - not sure :

  • I am using many desiredSize bindings in the template. Maybe I could simplify it by just using Panel.Spot and stretch ?
  • The strokeWidth of 10 * GRID_SPACING + 5 ? Maybe it’s possible to simplify this one as well and display the Arc Circle (Graduated) and the Full Circle (Background) in another easier way ? (Next challenge would be the Indicator after changing that ?)

Otherwise, if everything is fine with the template, how to display the ticks in the right position ?

Thank you.

Yes, ideally one has at most one object whose desiredSize is set or bound. And if the node is resizable, it would be that one object (a.k.a Part.resizeObject).

It is commonplace to have an “Auto” Panel (that might be resizable) and have some of its elements stretch to Fill so that they cover the same area.

It is also possible to do that with a “Spot” Panel.

Yep that’s the next step for me, I will try to enhance the template.

Right now I think I will go with two GraduatedPanels :

  • One to display just the Min and the Max ticks
  • The second one for the other ticks.

Another question : In this example here I don’t understand why the GraduatedPanel does not display the max tick 1000000000.
Despite I see the same value if I use it as the minimum.
So I guess it’s not a limit or something. Is there any reason for that ? How could I fix this issue ?

Also, I noticed that there are some issues in the graduatedSkip when I use real numbers due to the floating numbers. Sometimes the tick argument in the graduatedSkip method returns weird numbers like 0.199999999 instead of 0.2. I am using a hack to round the numbers according to theirs precisions and then I use graduatedFunction in the tick TextBlock to display the accurate number.

Would the two Graduated Panels have the same min and max values and same main path shape? I’m wondering if it wouldn’t be easier and more efficient to just have one Graduated Panel and you draw two extra Shapes at the appropriate places based on Panel.graduatedPointForValue. Those Shapes at the min and max values wouldn’t be moving, would they?

Yes, whenever you do computations on floating point numbers you need to be careful dealing with equality. And you need to worry about accumulating errors when involving repeated computations. We do a lot of that in our code, and sometimes you need to as well.

That’s what I tried to do in the first codesandbox example. I tried to use graduatedPointForValue but I guess it doesn’t return an accurate position for some reason ? Maybe there is something wrong with my template ? I don’t really know.

image

Note that Panel.graduatedPointForValue returns a Point in the panel’s coordinate system. If the panel has been stretched, perhaps that’s why it seems to be at the wrong point.

Yes maybe that’s the source of inaccuracy. But I didn’t get the difference between a bindings that use graduatedPointForValue and using it in the resizingTool ? Using it in computeResize seems to work as expected.

Also, is there anyway to display the max tick 1000000000 ? It seems strange for me since I am using just integer (no floating number problems, I guess !)

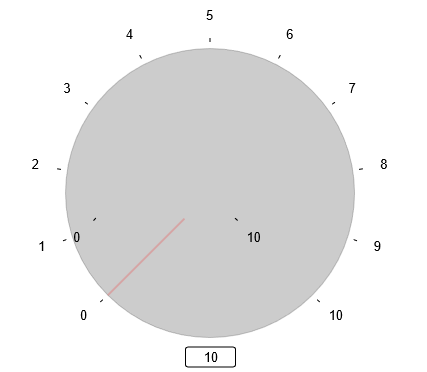
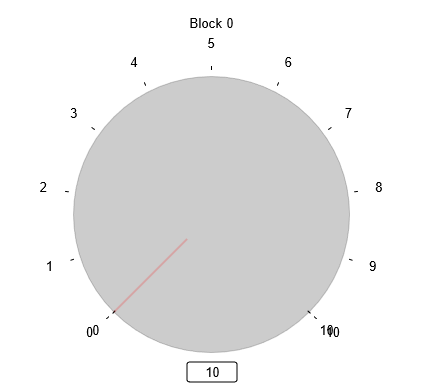
Here’s a complete example showing a copy of the gauge defined in An Instrument Gauge with an additional two lines that are at the min and max values of the graduated range of values shown by the panel.

Note that the min and max values are not a multiple of 10 or 5 or 2.5 (4, 2, and 1 multiples of the tick unit), so there would not be any tick mark drawn at those values.

<html><body>
  <div id="sample">
    <div id="myDiagramDiv" style="border: solid 1px black; width:100%; height:350px"></div>
  </div>
  <script src="https://unpkg.com/gojs"></script>
  <script id="code">
// Since 2.2 you can also author concise templates with method chaining instead of GraphObject.make
// For details, see https://gojs.net/latest/intro/buildingObjects.html
const $ = go.GraphObject.make;

myDiagram = $(go.Diagram, "myDiagramDiv");

myDiagram.nodeTemplate =
  $(go.Node, "Auto",
    $(go.Shape, "Circle",
      { stroke: "orange", strokeWidth: 5, spot1: go.Spot.TopLeft, spot2: go.Spot.BottomRight },
      new go.Binding("stroke", "color")),
    $(go.Panel, "Spot",
      $(go.Panel, "Graduated",
        {
          name: "SCALE", margin: 14,
          graduatedTickUnit: 2.5,  // tick marks at each multiple of 2.5
          graduatedMax: 100,  // this is actually the default value
          stretch: go.GraphObject.None  // needed to avoid unnecessary re-measuring!!!
        },
        new go.Binding("graduatedMin", "min"),  // controls the range of the gauge
        new go.Binding("graduatedMax", "max"),  // controls the range of the gauge
        // the main path of the graduated panel, an arc starting at 135 degrees and sweeping for 270 degrees
        $(go.Shape, { name: "SHAPE", geometryString: "M-70.7107 70.7107 B135 270 0 0 100 100 M0 100", stroke: "white", strokeWidth: 4 }),
        // three differently sized tick marks
        $(go.Shape, { geometryString: "M0 0 V10", stroke: "white", strokeWidth: 1.5 }),
        $(go.Shape, { geometryString: "M0 0 V12", stroke: "white", strokeWidth: 2.5, interval: 2 }),
        $(go.Shape, { geometryString: "M0 0 V15", stroke: "white", strokeWidth: 3.5, interval: 4 }),
        $(go.TextBlock,
          { // each tick label
            interval: 4,
            alignmentFocus: go.Spot.Center,
            font: "bold italic 14pt sans-serif", stroke: "white",
            segmentOffset: new go.Point(0, 30)
          })
      ),
      $(go.TextBlock,
        { alignment: new go.Spot(0.5, 0.9), stroke: "orange", font: "bold italic 14pt sans-serif" },
        new go.Binding("text", "key"),
        new go.Binding("stroke", "color")),
      $(go.Shape, { fill: "red", strokeWidth: 0, geometryString: "F1 M-6 0 L0 -6 100 0 0 6z x M-100 0" },
        new go.Binding("angle", "value", convertValueToAngle)),
      // a line at the MIN value
      $(go.Shape, { fill: null, stroke: "cyan", strokeWidth: 2, geometryString: "M80 0 L100 0 x M-100 0" },
        new go.Binding("angle", "min", convertValueToAngle)),
      // a line at the MAX value
      $(go.Shape, { fill: null, stroke: "cyan", strokeWidth: 2, geometryString: "M80 0 L100 0 x M-100 0" },
        new go.Binding("angle", "max", convertValueToAngle)),
      $(go.Shape, "Circle", { width: 2, height: 2, fill: "#444" })
    )
  );

// this determines the angle of the needle, based on the data.value argument
function convertValueToAngle(v, shape) {
  var scale = shape.part.findObject("SCALE");
  var p = scale.graduatedPointForValue(v);
  var shape = shape.part.findObject("SHAPE");
  var c = shape.actualBounds.center;
  return c.directionPoint(p);
}

myDiagram.model = new go.GraphLinksModel([
    { key: "Alpha", min: -2, max: 102, value: 35 },
    { key: "Beta", color: "green", min: 0, max: 142, value: 70 }
  ], [
    { from: "Alpha", to: "Beta" }
  ]);
  </script>
</body></html>

If you don’t want to show those extra lines when no data.min or data.max value is supplied by the node data object, you could do this:

      // a line at the MIN value
      $(go.Shape, { fill: null, stroke: "cyan", strokeWidth: 2, geometryString: "M80 0 L100 0 x M-100 0", visible: false },
        new go.Binding("angle", "min", convertValueToAngle),
        new go.Binding("visible", "min", m => true)),
      // a line at the MAX value
      $(go.Shape, { fill: null, stroke: "cyan", strokeWidth: 2, geometryString: "M80 0 L100 0 x M-100 0", visible: false },
        new go.Binding("angle", "max", convertValueToAngle),
        new go.Binding("visible", "max", m => true)),

Note how it defaults to be not-visible, but the binding, if successful, makes it visible.

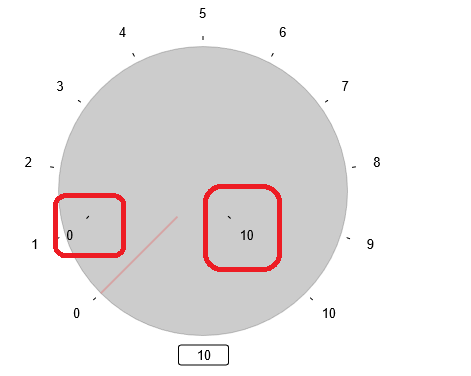
We’ll look into why it isn’t showing a tick mark at such a large value.

The problem of ticks/labels not showing at very large values will be fixed in the next version. That should be released in a week or two.

1 Like

We just released 2.2.11, which should resolve the problem of ticks/labels not being drawn at very large values.